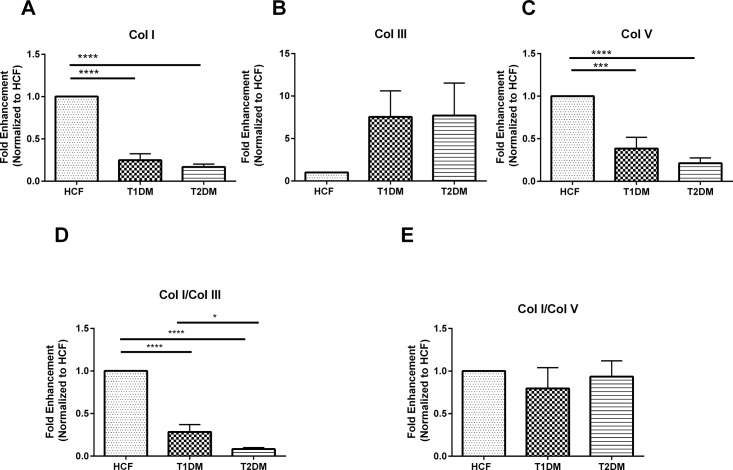
Fig 3.
mRNA expression for (A) Col I, B) Col III, C) Col V, D) Col I/Col III ratio, and E) Col/Col V ratio, in HCFs, T1DMs, T2DMs.(A-E) Quantification of gene expression and their ratios that are normalized to the loading control. n≥7 for HCFs, T1DMs and T2DMs. Error bars represent standard error of the mean. One-way ANOVA was performed (* = p≤0.05; ** = p≤0.01; *** = p≤0.001; **** = p≤0.0001).

