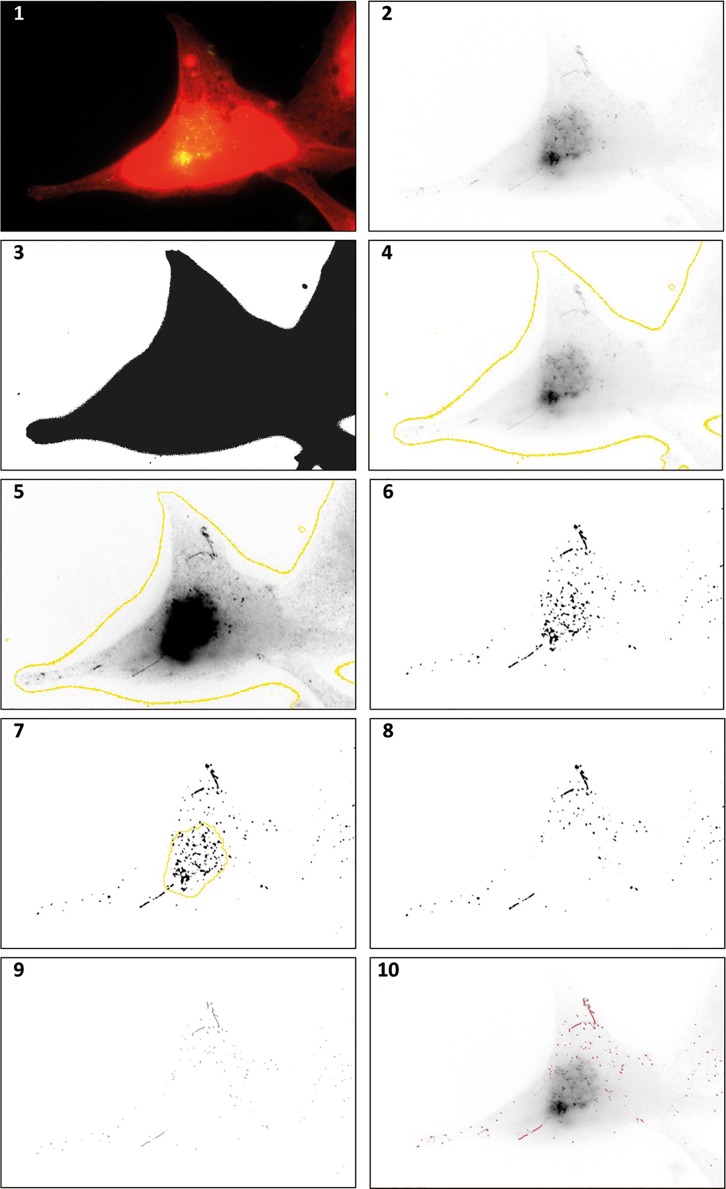
Fig 1. ImageJ processing of endosomal tubulation images.
Panel 1: HeLa cell stained with whole cell stain (red) and snx1 (green). Panel 2: Green channel only. Note the presence of endosomal tubules. Panel 3: Red channel only, used as a mask to exclude areas in the image that are not part of a cell from image analysis. Panel 4: Overlaid boundary from whole cell stain on the green channel. Panel 5: Green channel after image manipulation. Background subtraction, smoothing, contrast enhancement and noise removal have been carried out. These manipulations are necessary to facilitate successful representation of tubules in the next step. Panel 6: A binary image taken from image 5 for purposes of comparison. The microtubule organising centre (MTOC) can be seen as a dense area of Snx1 staining, which greatly increased noise in image analysis. Panel 7: The identification of the MTOC (yellow) allows its removal before an image is made binary. Panel 8: A binary image made after the MTOC has been removed. Panel 9: A ‘skeletonised’ image processed from the binary image. Tubules can then be identified with the ImageJ plugin “analyse skeleton”. Panel 10: Identified tubules (purple) overlaid on the original green only image from panel 2.

