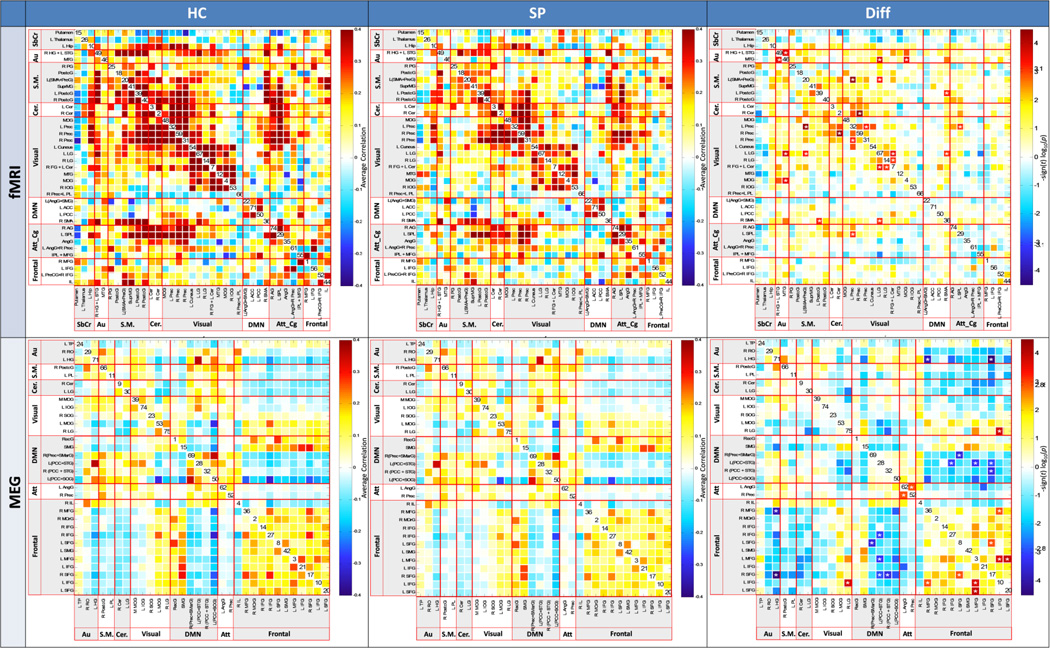
Figure 2.
Functional network connectivity (FNC) for fMRI (top) and MEG (bottom), for healthy controls (left column), Schizophrenia patients (center column), and FDR-corrected group differences (right column). ICA component numbers are on the diagonal. Color scale describes the p value after FDR correction.

