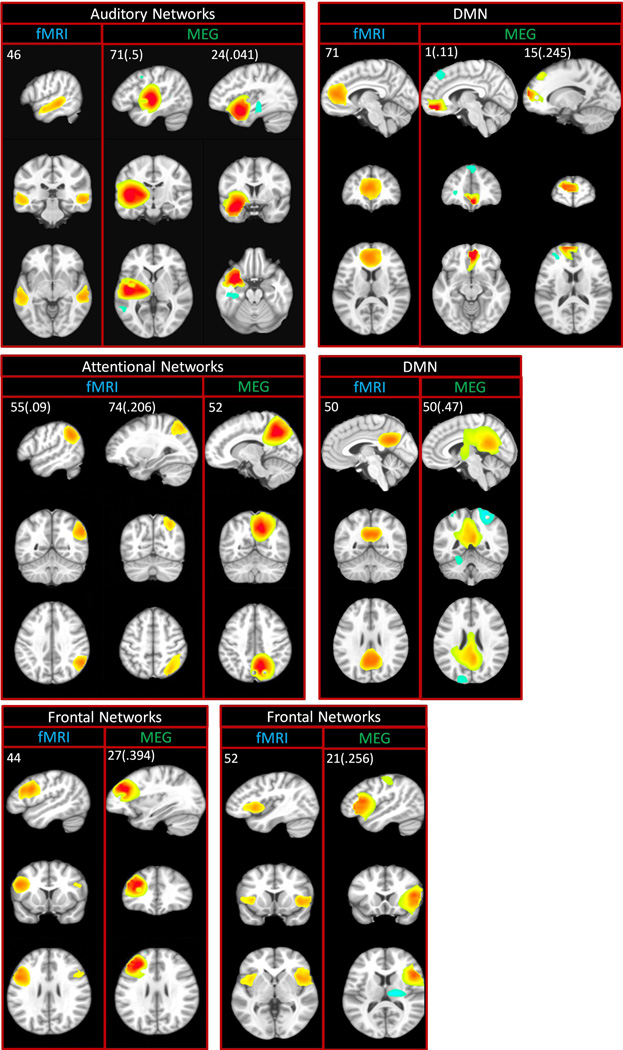
Figure 4.
Spatial overlap in spatial maps (ICA components) detected using MEG and fMRI. ICA component numbers are located in the upper left of each panel. Values in parentheses are the mean spatial correlation between the MEG and corresponding fMRI component. Color scale is z-scored component magnitude.

