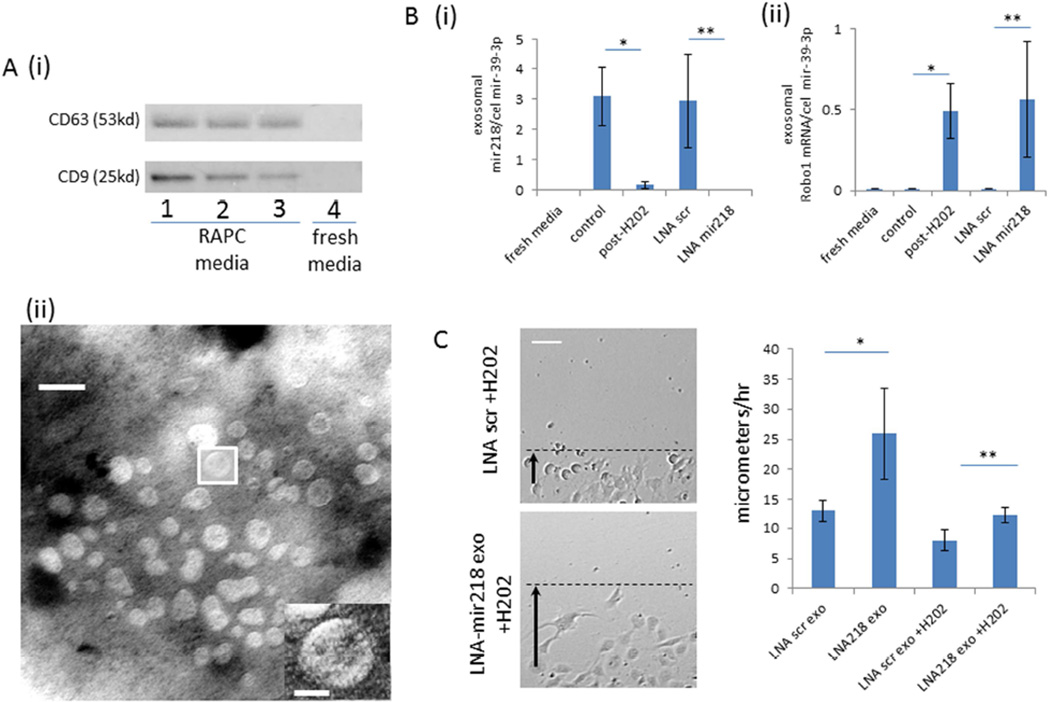
Figure 11.
Characterization of exosomes in RAPC following oxidant stress (A) [i] immunoblot of enriched exosome isolates probed for CD63 and CD9 protein expression from fresh media exposed to RAPC (lanes 1–3 derived from three separate patients) and fresh media not in contact with cells (lane 4), [ii] electron microscopy image of exosomes extracted from agar preparation (scale bar = 30 nanometers). (B)[i] Ratio of RAPC exosomal expression of mir-218 to cel-mir-39 (mean triplicate values from four separate patients, n=4 per group)(5 groups compared pairwise), control vs post-H202 (3.102 ±0.960 vs 0.174±0.127 [CI 0.968–4.889]; *, p=0.002), LNA scr vs LNA mir218 (2.951±1.539 vs 0.001±0.001 [CI 0.991–4.911; **, p=0.002) [ii] Ratio of exosomal Robo-1 mRNA expression to cel-mir-39 (mean triplicate values from four separate patients, n=4 per group)(5 groups compared pairwise), control vs post-H202 (0.001±0.002 vs 0.491±0.167 [CI −0.916 to −0.70]; *, p=0.016), LNA scr vs LNA mir218 (0.564±0.358 vs 0.002±0.002 [CI −1.017 to −0.111]; **, p=0.012) respectively (C) Migration of injured endothelial cells after treatment with exosomes isolated from RAPC+LNA-mir218 (n=4 per group, 5 groups compared pairwise). Rate of migration in LNA scr exo vs LNA 218 exo (n=5 per group) (13.0±1.8micrometers/hr vs 25.9±7.6micrometers/hr; *, p<0.001, [CI=−20.7 to −5.3]), LNA scr exo +H2O2 vs LNA 218 exo+H2O2 (8.0±1.7 vs 12.2±1.23; **, p<0.001, [CI=6.0–21.5]) respectively (scale bar =80micrometers).

