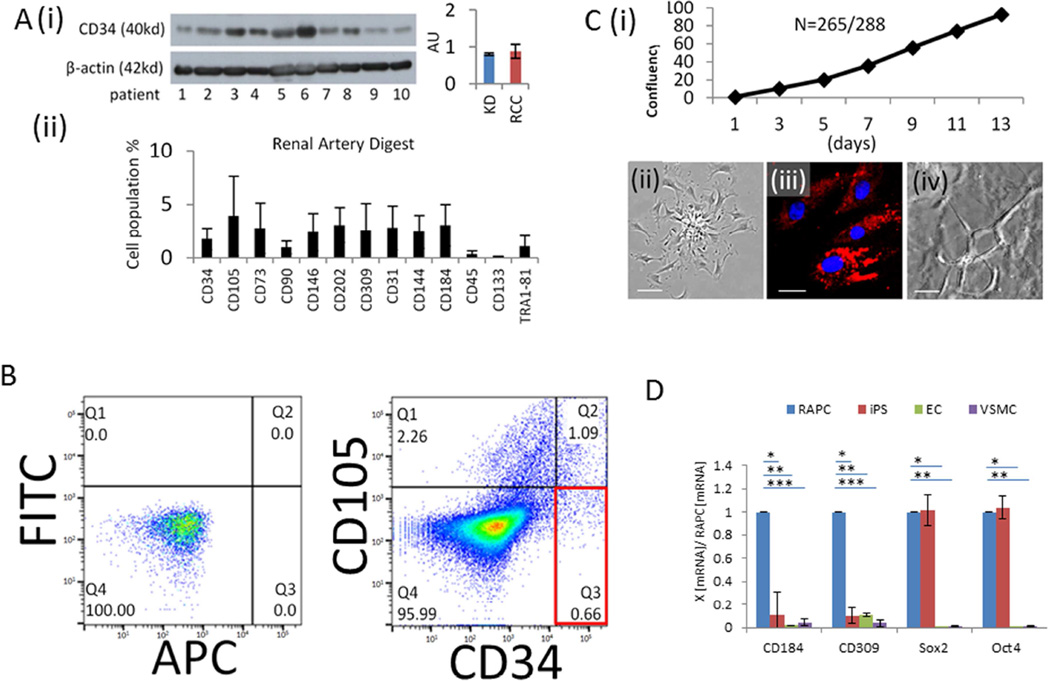
Figure 2.
Characterization of RAPC derived from human renal artery tissue. (A)[i] Representative immunoblot of human renal artery tissue probed for monoclonal anti-human CD34 antibody normalized to beta-actin tissue content. Indication for nephrectomy included living donor kidney donation (lane 1–3) and renal cell cancer (lane 4–10) (relative intensity, 0.80±0.032 vs 0.88±0.19, respectively (p=NS), [ii] Flow cytometry of whole digest (n=26), CD34 (1.8 ± 1.0 %), CD105 (3.9 ± 3.7), CD73 (2.8 ± 2.4), CD90 (1.0 ± 0.6), CD146 (2.4±1.8), CD202 (3.1 ± 1.6), CD309 (2.6 ± 2.5), CD31 (2.8 ± 2.0 %), CD144 (2.5 ± 1.5), CD184 (3.1±1.9), CD45 (0.4 ± 0.3), CD133 (0±0), TR181 (1.1 ± 1.0), (B) CD34+ /CD105− cells sorted(%), FITC/APC control (cell count=10,000), CD34+/CD105− (0.66±0.47), CD34+/CD105+ (1.09±0.42), CD34−/CD105+ (2.26±1.00) (n=22). (C)[i] Individually sorted CD34+/CD105− cells distributed into single wells of a 96-well plate, cultured in basal media, and monitored daily for colony formation and subsequently for confluency [ii] Phase contrast image of RAPC in monolayer on fibronectin-coated plates show a stellate body with cell progeny emanating from a central colony (scale bar =50micrometers) [iii] DiI fluorescence of RAPC after 6 hour exposure to DiI-ac-(human) LDL (scale bar =10micrometers) [iv] composite image (80µ depth) of RAPC treated with VEGF exhibiting capillary loop structures in matrigel media (scale bar =50micrometers) (D) Relative CD184, CD309, Sox2, and Oct4 mRNA expression by quantitative PCR in RAPC (n=10 separate patients), human iPS (n=10), human endothelial cells (EC) (n=10), and human aorta-derived vascular smooth muscle cells (VSMC)(n=10) (4 groups compared pairwise); CD184, RAPC vs iPS (1.00±0.00 vs 0.12±0.20)(*p<0.001, CI=0.77–1.03); CD184, RAPC vs EC (1.00±0.00 vs 0.02±0.00)(**, p<0.001, CI=0.76–1.01); CD184, RAPC vs VSMC (1.00±0.00 vs 0.046±0.03)(***, p<0.001, CI=0.86–1.12); CD309, RAPC vs iPS (1.00±0.00 vs 0.04±0.03)(*p<0.001, CI=0.89–1.02); CD309, RAPC vs EC (1.00±0.00 vs 0.11±0.02)(**, p<0.001, CI=0.83–0.96); CD309, RAPC vs VSMC (1.00±0.00 vs 0.04±0.03)(***, p<0.001, CI=0.93–1.06); Sox2, RAPC vs iPS (1.00±0.00 vs 1.02±0.13)(p=NS, CI=−0.06–1.0); Sox2, RAPC vs EC (1.00±0.00 vs 0.03±0.02)(*, p<0.001, CI=0.88–1.05); Sox2, RAPC vs VSMC (1.00±0.00 vs 0.00±0.00)(**, p<0.001, CI=0.91–1.08); Oct4, RAPC vs iPS (1.00±0.00 vs 1.04±0.10)(p=NS, CI=−0.11–0.03); Oct4, RAPC vs EC (1.00±0.00 vs 0.04±0.05)(*, p<0.001, CI=0.89–1.02); Oct4, RAPC vs VSMC (1.00±0.00 vs 0.00±0.00)(**, p<0.001, CI=0.93–1.06).

