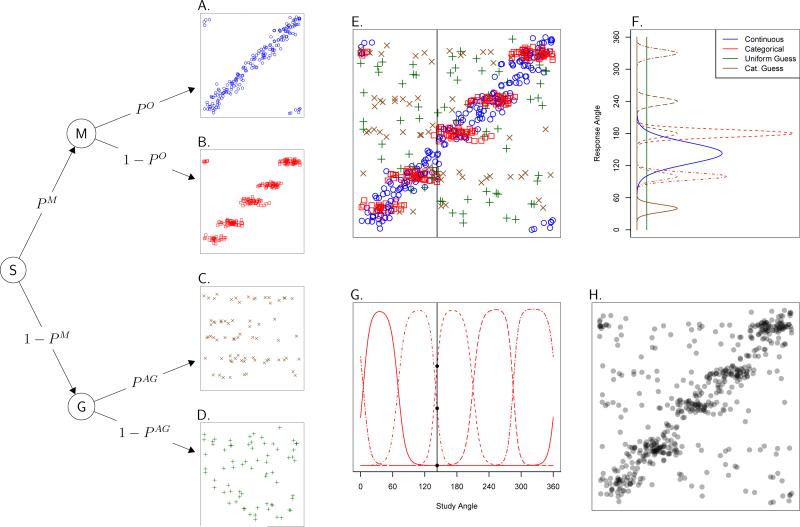
Figure 2.
Multinomial process tree for the model and related plots. For the scatterplots in Panels A to E and H, the x-axis is the study angle and the y-axis is the response angle. The points in those scatterplots are data sampled from an imaginary participant with 5 color categories. Panels A to D show individual response types and Panel E shows the points in Panels A through D in one panel. Panel H shows the same points as Panel E, but without information about the type of the response. Panel F shows the response densities for the different response types for a single study angle, indicated by the vertical line in Panel E. Panel G shows the function that gives the probability that a given study angle will be assigned to the given category.

