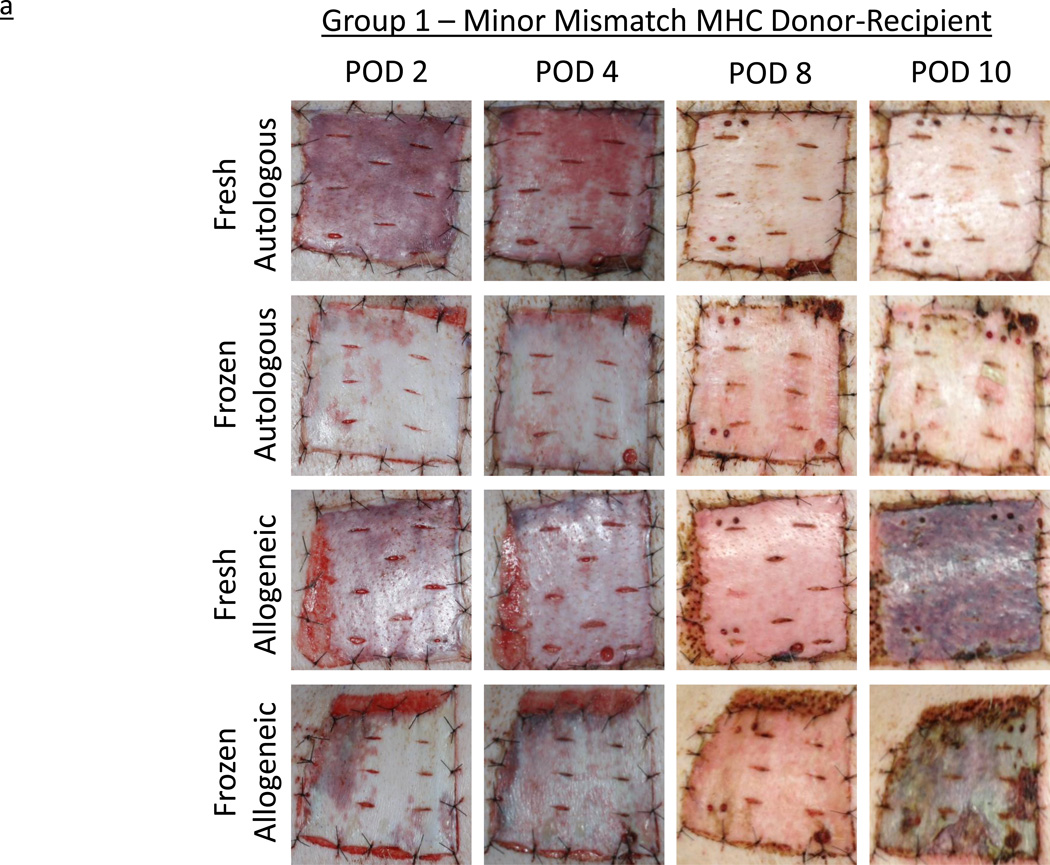
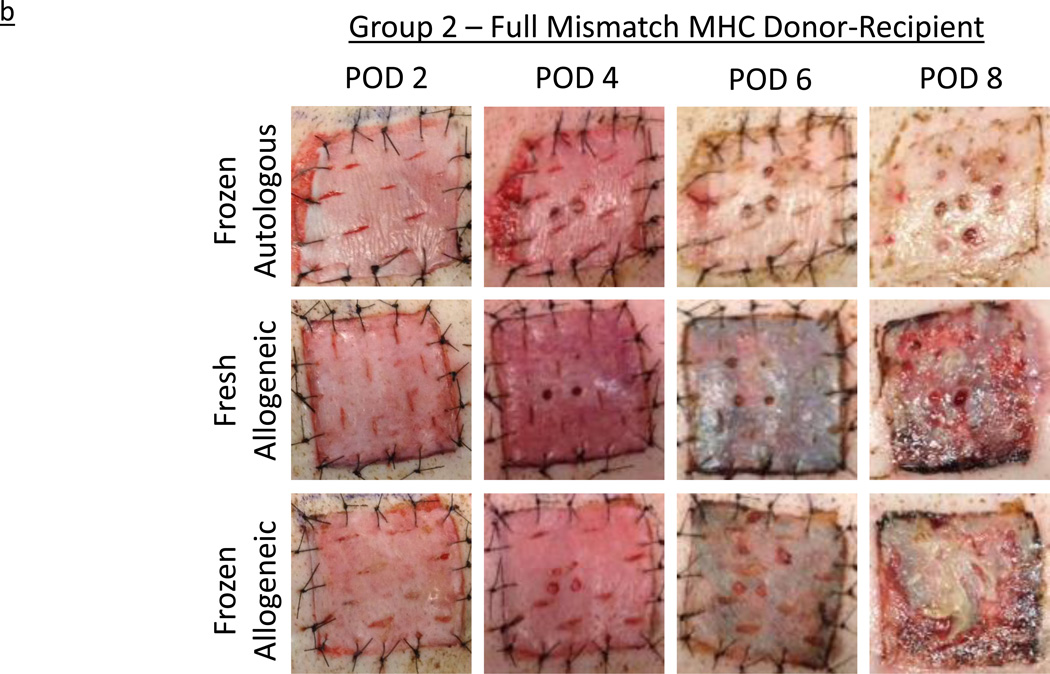
Figure 2.
a – Experimentally obtained images illustrating the rejection time course of autologous and allogeneic, fresh and frozen, split-thickness skin grafts in minor mismatched MHC experimental series, Group 1. Horizontal legend denotes post-operative day (POD); vertical legend denotes skin graft type.
b – Experimentally obtained images illustrating the rejection time course of autologous and allogeneic, fresh and frozen, split-thickness skin grafts in fully mismatched MHC experimental series, Group 2. Horizontal legend denotes post-operative day (POD); vertical legend denotes skin graft type.


