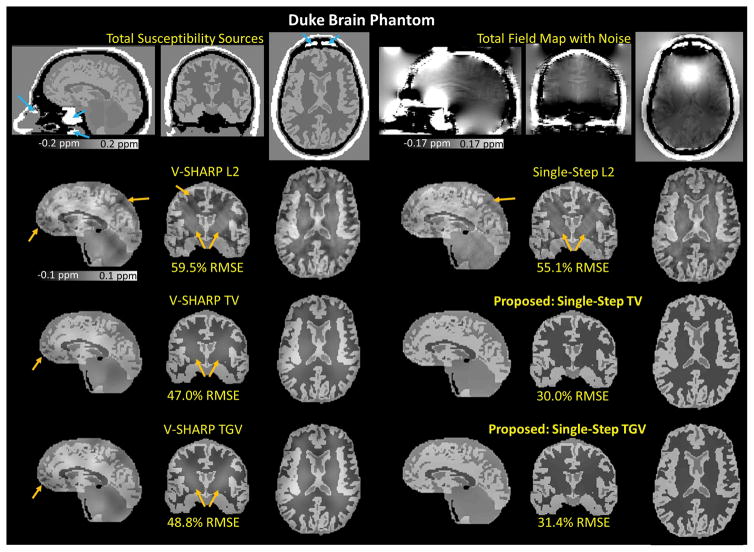
Figure 3.
Duke Brain Phantom. The reconstructed magnetic susceptibility maps obtained from six different QSM algorithms (5 SMV kernels) with their corresponding RMSEs. The blue arrows indicate the magnetic susceptibility sources (9.2 ppm) that mimic internal air in the nasal cavity and ear canal. The orange arrows indicate the apparent remaining dipole artifacts and background phase contamination.

