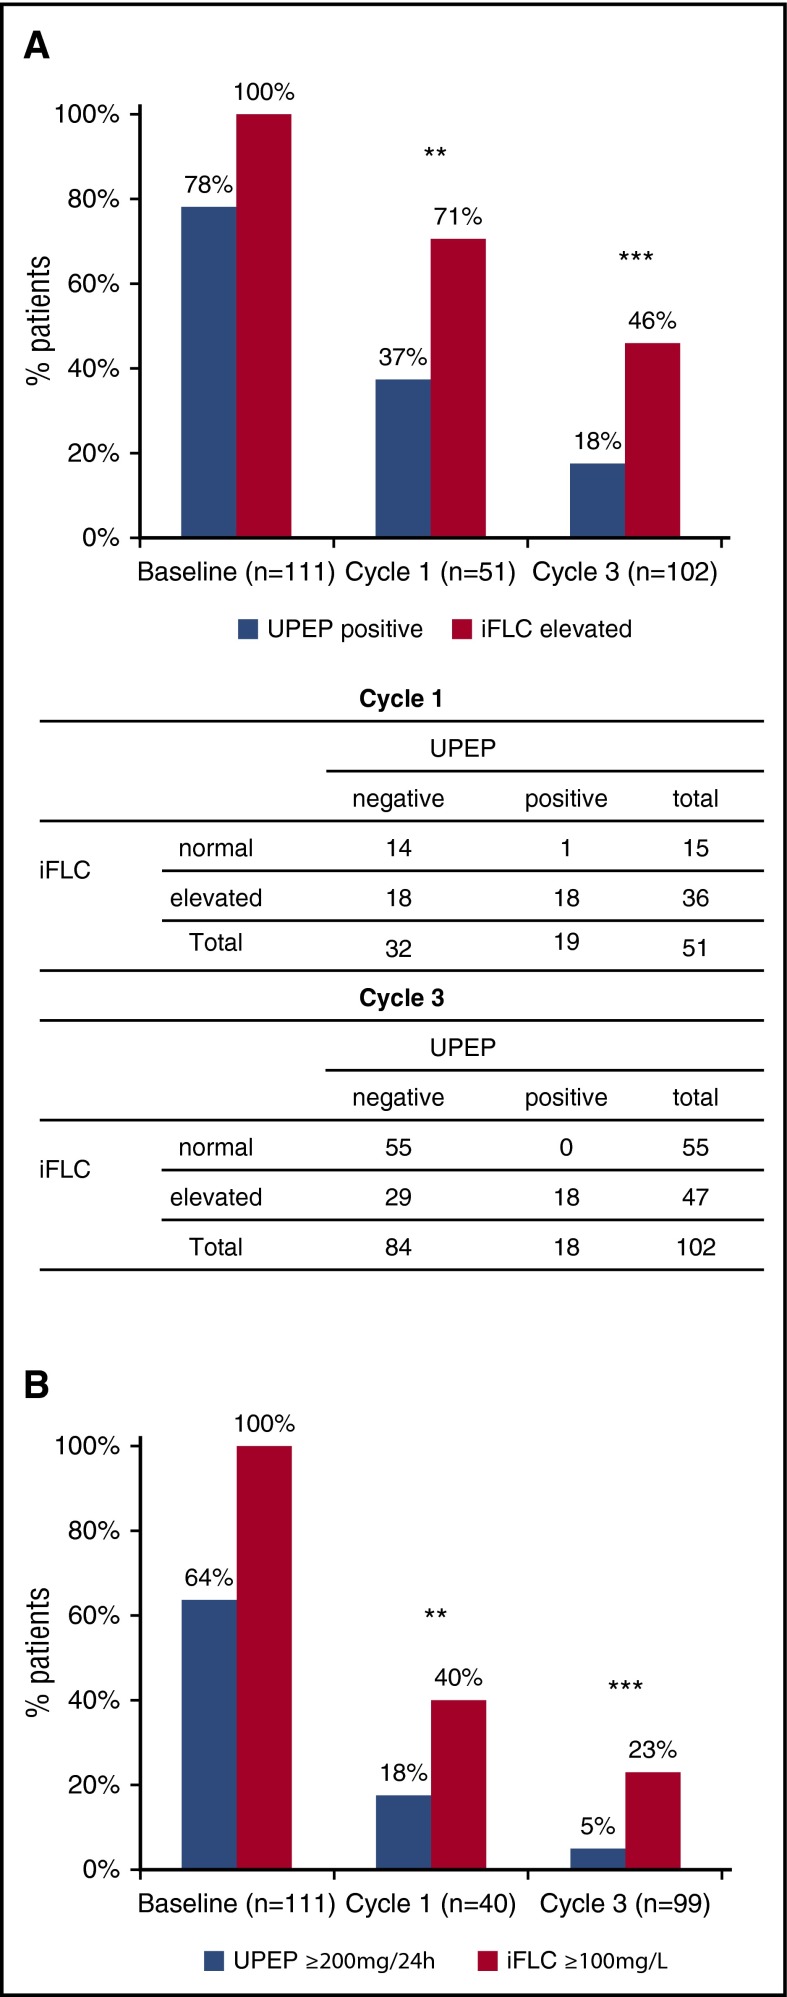
Figure 1.
Sensitivity of urine FLC and sFLC measurements. (A) Percentage of patients with positive UPEP and elevated serum iFLC at baseline, and after 1 and 3 cycles of treatment (P = .004 and P < .001, respectively; baseline not evaluable as 100% patients had elevated iFLC). Below are comparative tables with number of patients identified by either test at cycles 1 and 3. (B) Percentage of patients with measurable levels of disease as determined by UPEP (≥200 mg per 24 hours) and serum iFLC (≥100 mg/L) measurements at baseline, and at end of cycles 1 and 3 (P = .007 and P < .001, respectively; baseline not evaluable as 100% patients had measurable disease by iFLC). P values calculated by χ2 test. Comparisons at each time point include patients with matched urine and serum data.

