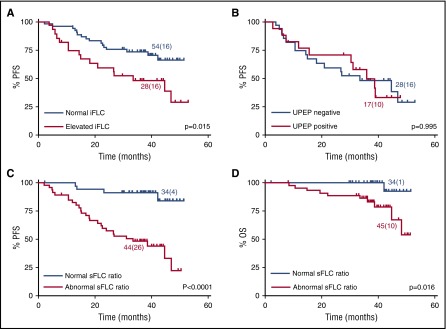
Figure 3.
Abnormal sFLC measurements stratify patients with normal urine results after induction. PFS according to (A) normal vs elevated iFLC in patients with a negative UPEP result (median PFS, not reached and 34 months, respectively), (B) negative vs positive UPEP in patients with elevated iFLC (median PFS, 34 and 36 months, respectively), and (C) normal vs abnormal κ:λ sFLC ratio in patients with negative uIFE (median PFS, not reached and 31 months, respectively). (D) OS for patients with normal vs abnormal κ:λ sFLC ratio in patients with negative uIFE (median OS not reached for both). P values calculated by log-rank test. Number of patients (events) for each arm is indicated. Comparisons include patients with matched urine and serum data.

