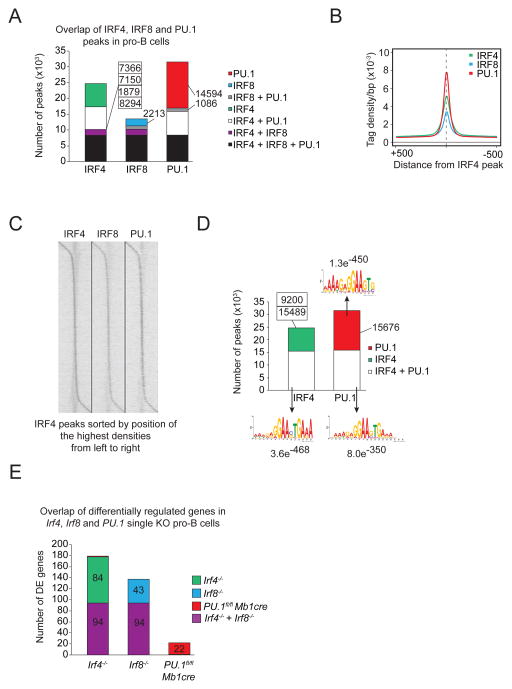
Figure 1.
Overlapping binding sites between PU.1, IRF4 and IRF8. A) Co-localization of IRF4, IRF8 and PU.1 peaks in pro-B cells were determined by multiple overlap analysis of the respective ChIP-seq data. The number of binding sites for each overlap is shown. B) The average density of IRF4− (green), IRF8− (blue) and PU.1-binding (red) in pro-B cells are shown for a 5 kb region centered on the summits of the IRF4 peaks. C) The densities of IRF4−, IRF8− and PU.1-binding in pro-B cells are displayed as a heat map, sorted by position of the highest IRF4 peak density, from upstream to downstream. D) Overlap of IRF4− and PU.1-binding in pro-B cells. The number of binding sites is indicated together with the top-ranked motif identified with the indicated E-value. For IRF4-only binding sites no significant motif could be found. E) Multiple overlap of differentially regulated genes of Irf4, Irf8 and PU.1 single KO pro-B cells. The number of differentially regulated genes is shown for the respective overlap.

