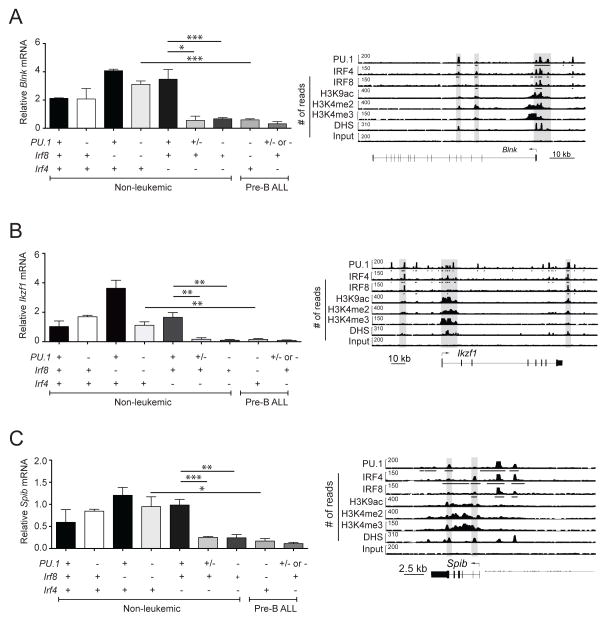
Figure 7.
Spib and Ikzf1 are transcriptionally activated by PU.1 and IRF proteins. (A–C) RNA samples from healthy pre-B cells (identified as B220+CD19+cKit−IgM−) and leukemias of the indicated genotypes were subjected to RT-qPCR to measure the relative expression of steady-state mRNA transcripts for Blnk (A), Ikzf1 (B) and Spib (C). Transcript frequencies were normalized to Hprt transcript levels. The data are mean ± SD between 2 to 10 samples per genotype. p values compare the indicated groups using a paired t test (two tailed). Lower panels, ChIP-seq analysis of PU.1, IRF4, and IRF8 binding and the indicated histone modifications and DNase I hypersensitive sites (DHS) at the regulatory regions of Blnk (A), Ikzf1 (B) and Spib (C) in short-term cultured pro-B cells. Gray boxes highlight the PU.1-IRF binding peaks. Arrows indicate the direction of gene transcription. Bars below the ChIP-seq tracks indicate transcription factor-binding regions identified by MACS peak calling. Symbols in (A–C) represent the existence of two (+), one (+/−) or no (−) functional alleles for the indicated genes. p values compare the indicated groups using a paired t test (two tailed). * p <0.05, ** p<0.005, *** p<0.0005.

