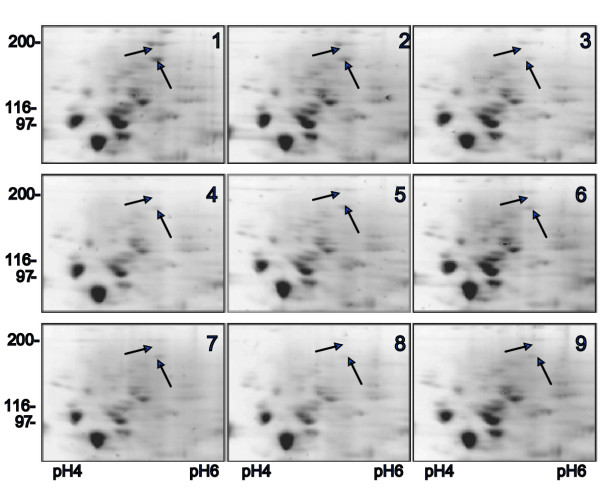
Figure 2.
2D gel images from a representative optimisation experiment. Nine rehydration buffers were tested according to Table 1. Each buffer was used to solubilise 50 μg whole Xenopus egg extract and each sample was run on identical gels under identical conditions. (1–9) are images of high molecular weight regions of 9 gels with arrows pointing to some spots whose intensity and focusing pattern changed considerably between different RB compositions. Total numbers of detected spots in individual gels are presented in Table 1.

