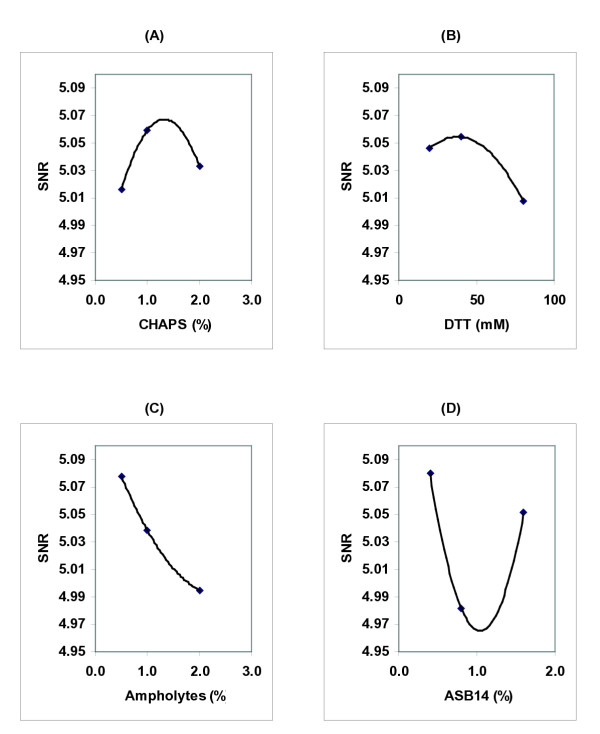
Figure 3.
Effects of reaction components on SNR functions in a representative experiment. The Taguchi calculations were carried out using total number of spots detected by imaging software in 2D gels (Table 1). The optimal concentration of each component corresponded to the highest value of the SNR function (a–d).

