
FIGURE 1.
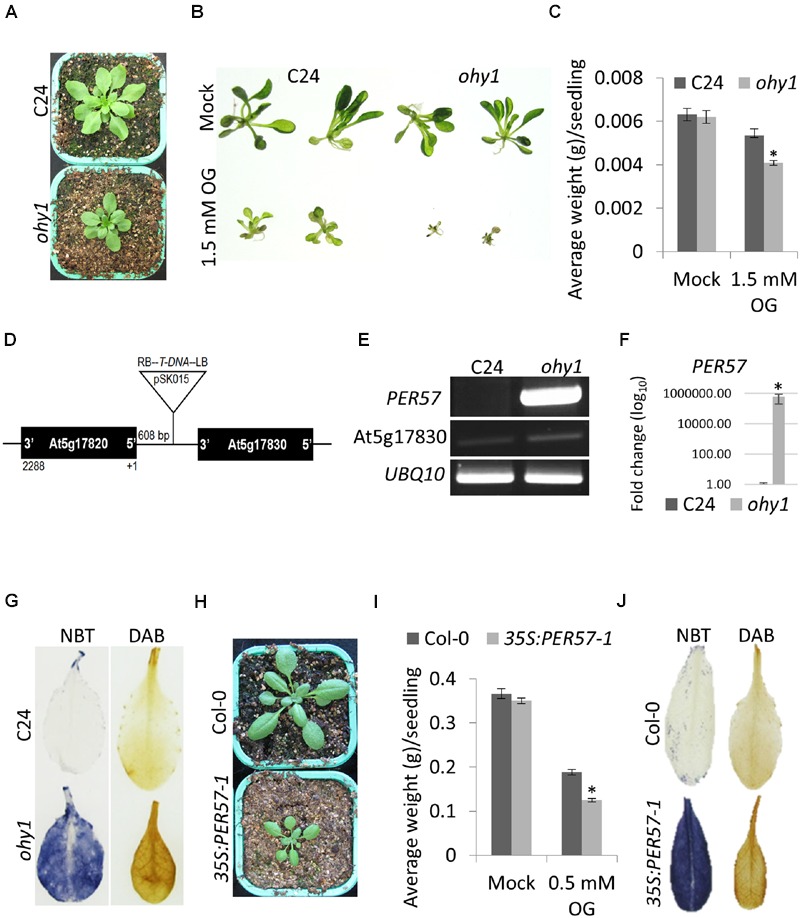
Phenotypic and molecular characterization of A. thaliana ohy1 plants. (A) The growth phenotypes of 21-day-old C24 and ohy1 plants. (B) The effect of 1.5 mM OGs on C24 and ohy1 seedling growth. (C) Growth inhibition triggered by OGs in 10-day-old C24 and ohy1 seedlings (n = 96, ±SD). ∗p < 0.05, Student’s t-test. (D) Location of the T-DNA insertion in ohy1 plants. The T-DNA was inserted 608 bp upstream of the start codon of PER57 (At5g17820), with the T-DNA right border oriented toward the ATG codon. (E) Gene expression of PER57 and At5g17830 was measured from the leaves of 28-day-old C24 and ohy1 soil-grown plants using RT-PCR. UBQ10 was used as the internal control. (F) Gene expression of PER57 was measured from the leaves of 28-day-old C24 and ohy1 soil-grown plants using quantitative RT-PCR, normalized to EF1α and UBQ10. Error bars represent the standard deviation of three biological replicates. ∗p < 0.05, Student’s t-test. (G) The leaves of 28-day-old C24 and ohy1 plants were stained using NBT and DAB to detect the accumulation of superoxide and hydrogen peroxide, respectively. (H) Growth phenotypes of 21-day-old Col-0 and 35S:PER57-1 plants. (I) Growth inhibition triggered by OGs in 21-day-old Col-0 and 35S:PER57-1 seedlings (n = 48, ± SD). ∗p < 0.05, Student’s t-test. (J) Leaves of 28-day-old Col-0 and 35S:PER57-1 plants were stained using NBT and DAB to detect the accumulation of superoxide and hydrogen peroxide, respectively. All experiments were repeated at least three times with similar results.