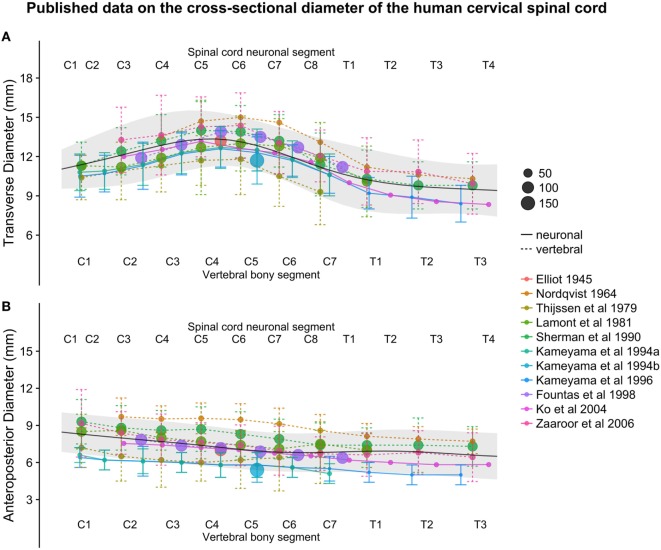
Figure 3.
(A,B): figure illustrates measurements of the human cervical spinal cord transverse [panel (A)] and anteroposterior diameter [panel (B)] from different published studies. The size of the dots represents the number of subjects included in each study. The full black line shows the continuous population estimate from the general additive model, and the gray ribbon represents the population estimate ± 2 standard deviations (SDs) (based on the SDs of the studies).

