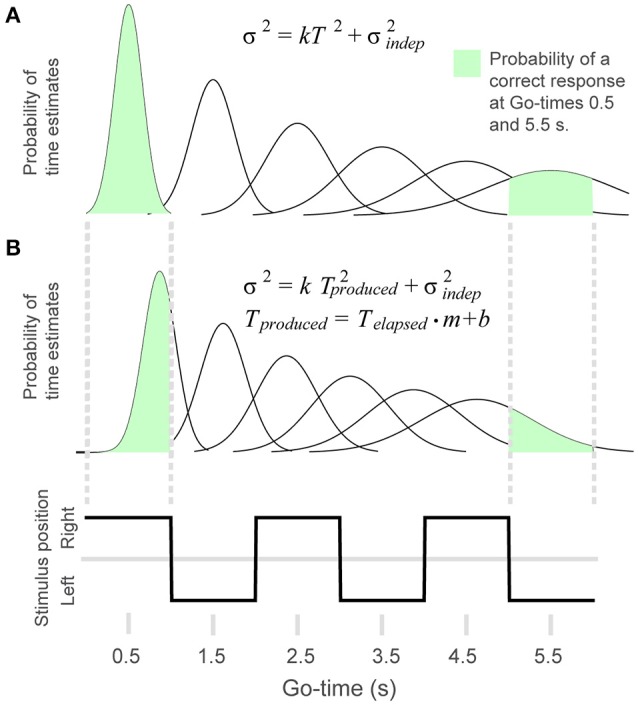
Figure 2.

To model behavioral performance we adapted the generalized Weber law to the rhythm task. (A) The Gaussian distributions illustrate the time-dependent increase in variability of the timing estimates. The probability of a correct response was calculated as the area of the Gaussian curve comprised within the interval defined by a given Go-time. The probability of a correct response for Go-times 0.5 and 5.5 s is illustrated in green. (B) In the 4-parameter equation, produced time is modified by multiplicative and additive factors. This allows the model to capture systematic errors like shortening or lengthening of elapsed time. The figure illustrates the distributions resulting from a positive displacement and a shortening of time estimates.
