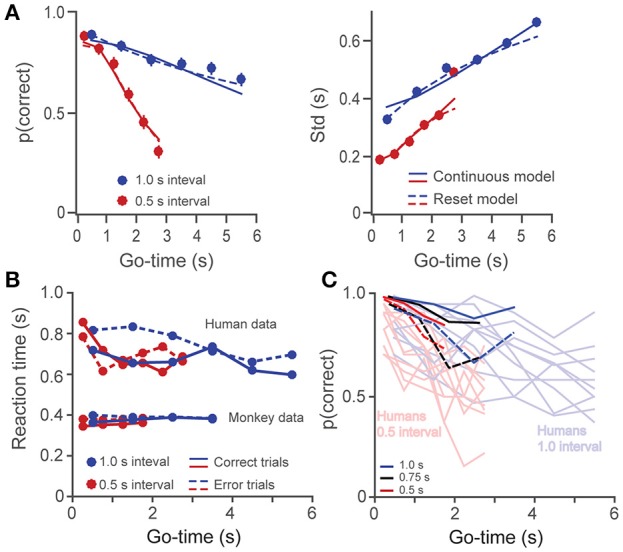
Figure 3.

(A) The probability of a correct response (left panel) and the standard deviation (right panel) are plotted as a function of Go-time, separately for the short and long intervals (0.5 and 1 s, human data on the 6-choice task). Solid and broken lines depict model fittings of a continuous (Equation 1) and a reset (Equation 3) model of timing. Both models provided similarly good fits. (B) Reaction times as a function of Go-time. Humans had significantly higher reaction times which tended to decrease with Go-time. (C) Single subject data for monkeys (n = 2) and humans (n = 10) in the 2-choice task. The probability of correct responses p(correct) is plotted as a function of Go-time. Light colors are used for humans and dark ones for monkeys. Broken dark lines as used for monkey 2 data.
