Figure 5.

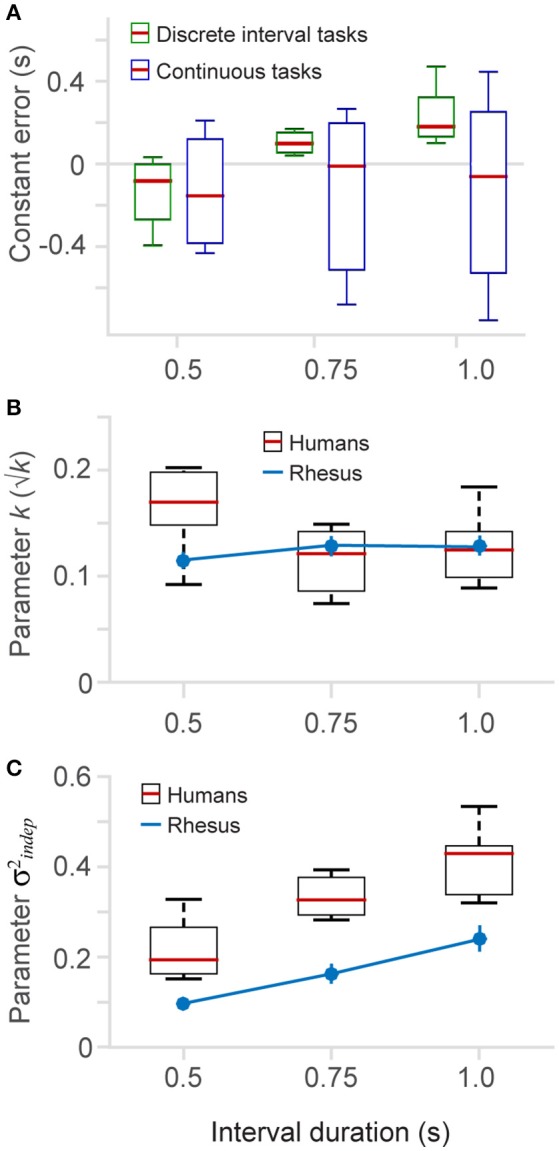
Constant error and fitted parameters. (A) The constant error (difference between produced and true elapsed time) is plotted for the different time intervals (0.5, 0.75, and 1.0 s), separately for the discrete (6 and 8-choice) and continuous versions of the task. (B) The fitted parameter k (Equation 1) as a function of interval duration (boxplots human data, n = 6; blue lines monkey data, n = 2) (2-choice, 6-choice, 8-choice (insert in Figure 4C), continuous with three interval durations (insert in Figure 4D), and also from a dataset of the continuous task that is not show in results). (C) Parameter (Equation 1) as a function of interval duration.
