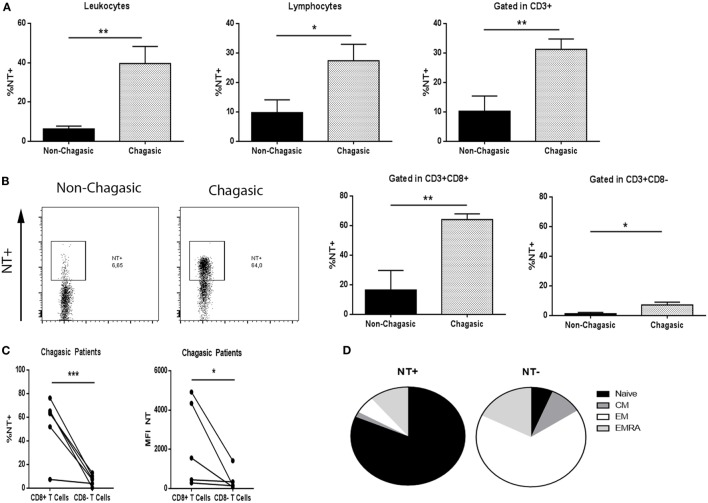
Figure 3.
CD8+ T lymphocytes from chagasic patients present high tyrosine nitration. (A) Percentage of nitrated (NT) leukocytes, lymphocytes, and T cells from seropositive patients (n = 6) and seronegative donors (n = 6). (B) Representative dot plot of tyrosine nitration on cytotoxic T-cell surface and percentage of NT+CD3+CD8+ and NT+CD3+CD8− lymphocytes from chagasic patients (n = 6) and non-chagasic donors (n = 6). (C) Percentage of NT+CD3+CD8+ and NT+CD3+CD8− and mean fluorescence intensity of NT in CD3+CD8+ and CD3+CD8− cells from chagasic patients (n = 5) (*p < 0.05, **p < 0.01, and ***p < 0.001). (D) Frequency of naïve, central memory, effector memory (EM), and effector memory RA gated in NT+ or NT− in CD8+ cells from chagasic patients (n = 4) (naïve NT+ vs. naïve NT−, p < 0.0001; EM NT+ vs. EM NT−, p < 0.0001).

