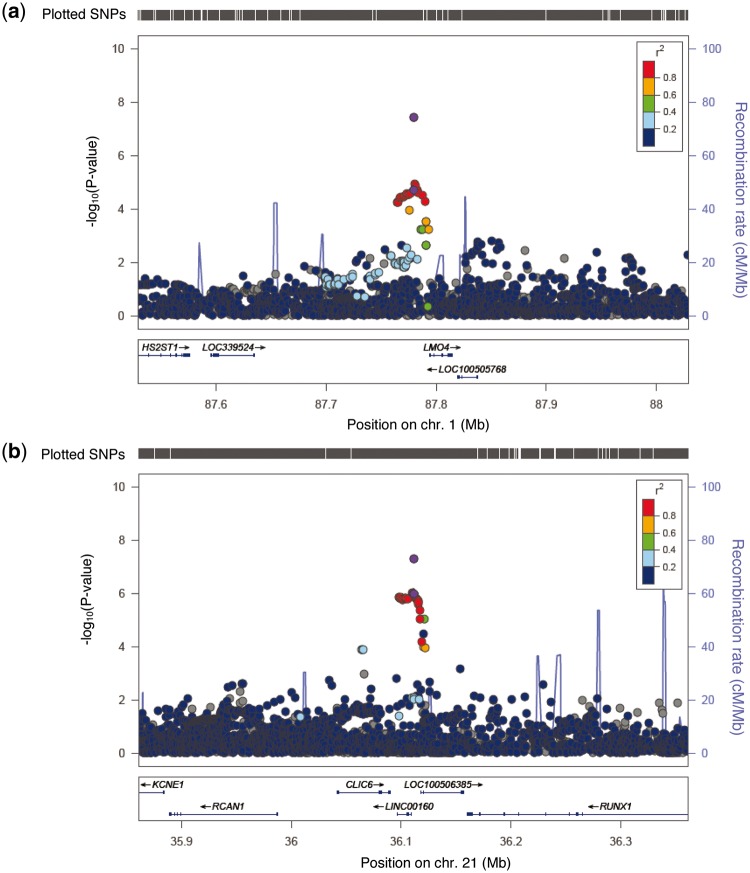
Figure 2.
Regional plots of association results for the two newly identified risk loci for breast cancer. (A) rs12118297. (B) rs16992204. Each plot shows the -log10 P-values (y-axis) for each SNP in a given genomic region on the x-axis based on NCBI Build 37. The marker SNPs are shown in purple circles and Refseq genes are shown beneath each plot. The top SNPs (rs12118297 and rs16992204) with purple circles are from the meta-analyses of all studies conducted among East Asians, and data shown for all other SNPs are from Stage I only. Pairwise LD with adjacent SNPs as measured by r2 values (according to the 1000 Genomes Project Phase 3 Asian data) is indicated by the color of each circle. (a) rs12118297. (b) rs16992204. Combined P-values for SNPs rs12118297 and rs16992204 were 4.48 x 10− 8 and 4.63 x 10− 8, respectively.

