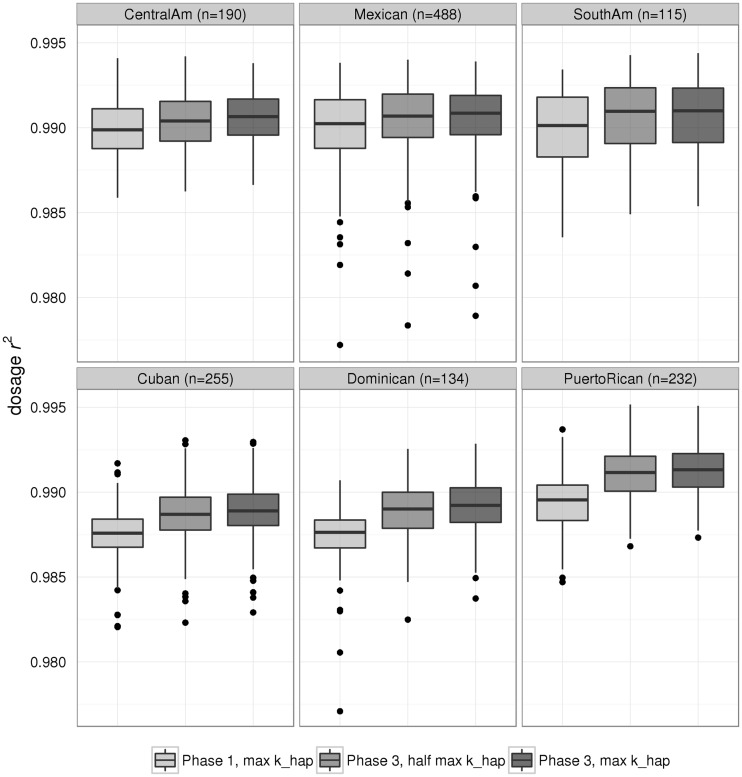
Figure 2.
Distributions of by-sample dosage r2 between observed and imputed allelic dosages. These distributions are over chromosome 22 variants from the supplemental Omni2.5SS array, presented as boxplots separately by genetic analysis group. The three Mainland groups are in the top row, and the three Caribbean groups are in the bottom row. Sample counts within each group are included in the panel headers. Excluded from these plots are 10 HCHS/SOL samples that have missing genetic group (i.e. are genetic outliers), thus there are 1414 total samples plotted here.

