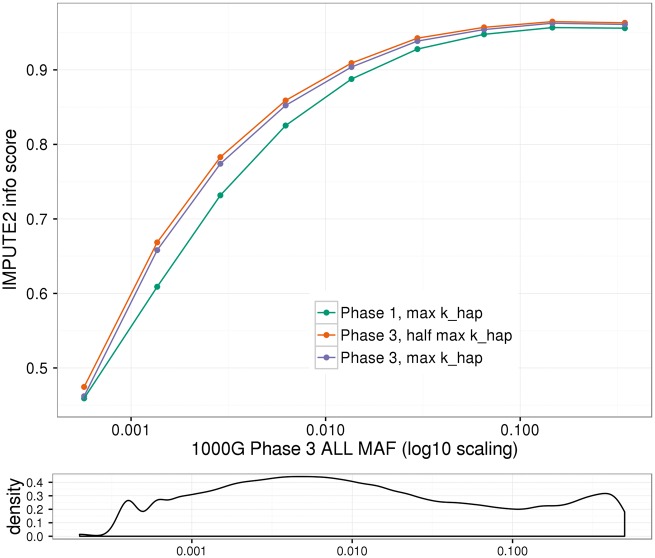
Figure 4.
Info score across all imputed variants. Info scores are plotted separately by imputation setting, for chromosome 22 variants imputed across all three settings (i.e. imputed with both 1000 Genomes Phase 1 and Phase 3 reference panels; n = 308 017 variants). For plotting, variants were binned by MAF in the worldwide (ALL) 1000 Genomes Project Phase 3 panel. The mean MAF per bin is plotted on the x-axis with log10 scaling; the mean info score over variants in the bin is plotted on the y-axis. The density plot in the sub-panel illustrates the density of variants across the (log10 scaled) MAF spectrum.

