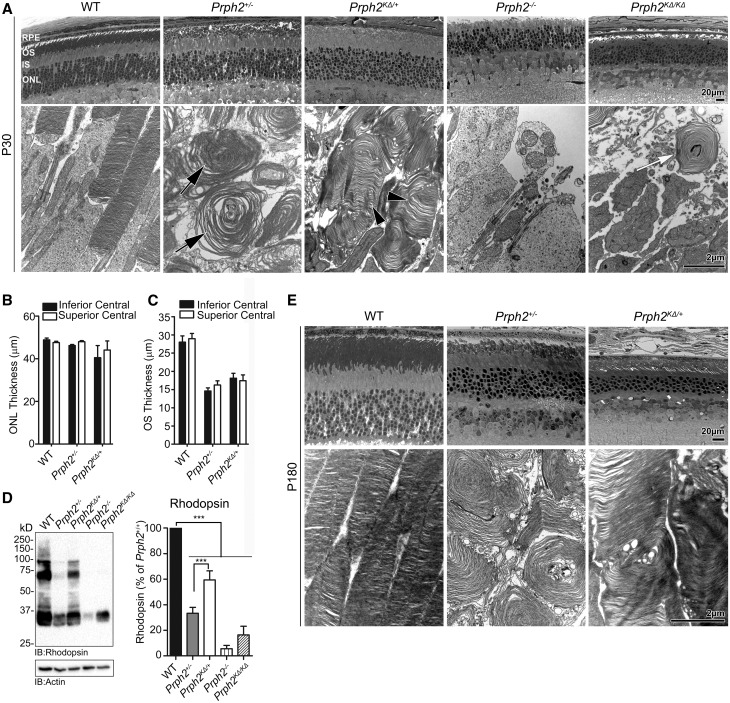
Figure 2.
K153ΔPrph2 is unable to support normal OS formation. (A) Shown are representative light microscopy (top) and transmission EM (bottom) from the indicated genotypes at P30. Black arrow indicate whorl OSs characteristic of the Prph2+/−, arrowheads indicate improved disc stacking and alignment in the Prph2KΔ/+ while white arrows indicate the highly malformed OSs of the Prph2KΔ/KΔ. (B–C) ONL thickness (B) and OS length (C) was measured from the superior and inferior central retina and plotted as a mean ± SEM, n = 3–5 eyes/genotype. (D) Rhodopsin protein levels were assessed by SDS-PAGE/western blot and quantified, plotted are means ±SEM, n = 3–7 retinas/genotype, ***P < 0.001 by one-way ANOVA with Bonferroni’s post-hoc comparison. (E) Shown are representative light microscopy (top) and transmission EM (bottom) from the indicated genotypes at P180. Scale bars are 20 µm (light images) and 2 µm (EM images). RPE: retinal pigment epithelium, OS: outer segment, IS: inner segment, ONL: outer nuclear layer.

