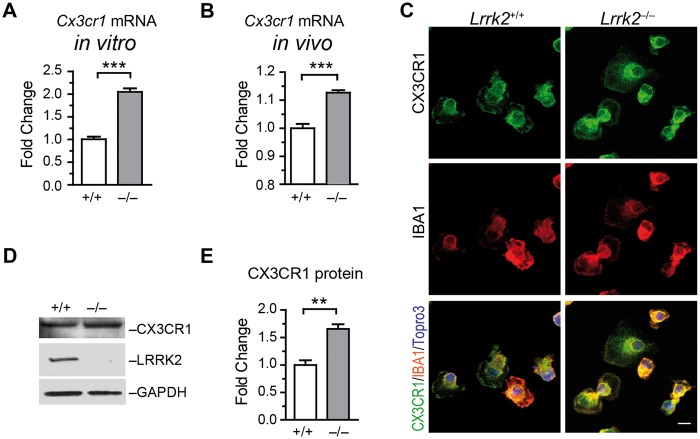
Figure 2.
Lrrk2–null microglia show increased Cx3cr1 mRNA and protein expression. (A, B) Bar graphs depict Cx3cr1 mRNA expression in cultured microglia (A) and mouse brains (B). Values represent mean ± S.E.M. Significant differences between the groups are determined by Student’s t-test and expressed as follows: ***P<0.001. N = 5 per group. (C) Representative images show CX3CR1and IBA1 co-staining at cultured microglia. Scale bars, 10 μm. (D) Western blot analyses the expression of CX3CR1 and LRRK2 proteins in cultured microglia. GAPDH was used as the loading control. (E) Bar graph shows CX3CR1 protein levels in cultured Lrrk2+/+ and Lrrk2–/– microglia. Values represent mean ± S.E.M. Significant differences between the groups were determined by Student’s t-test and expressed as follows: **P<0.01. N = 3 per group.

