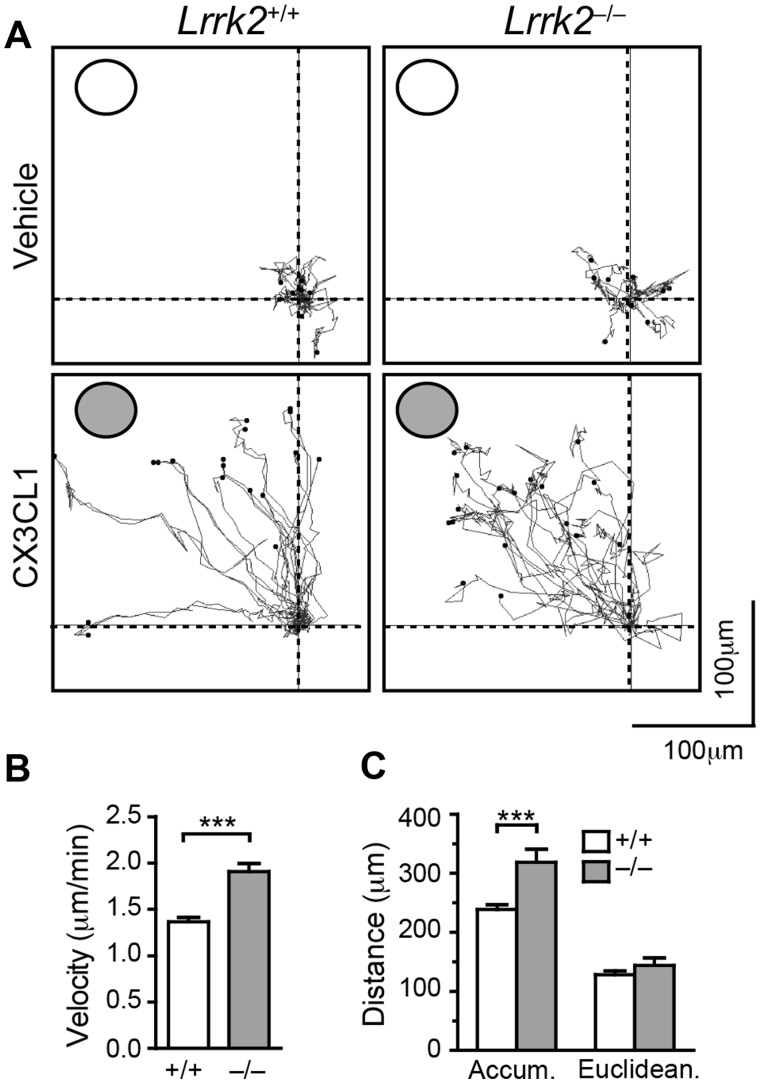
Figure 4.
Lrrk2–null microglia show enhanced motility toward to the source of Fractalkine application. (A) Representative traces show the movement of microglia in the absence or presence of 5 nM Fractalkine in the outer well. Each dot represents an individual microglial cell. The outer wells are marked with circles. (B, C) Bar graphs show the velocity (B), as well as the accumulative (accum) and Euclidean distance (C) of microglia during the tracing period. The data were derived from three independent experiments.

