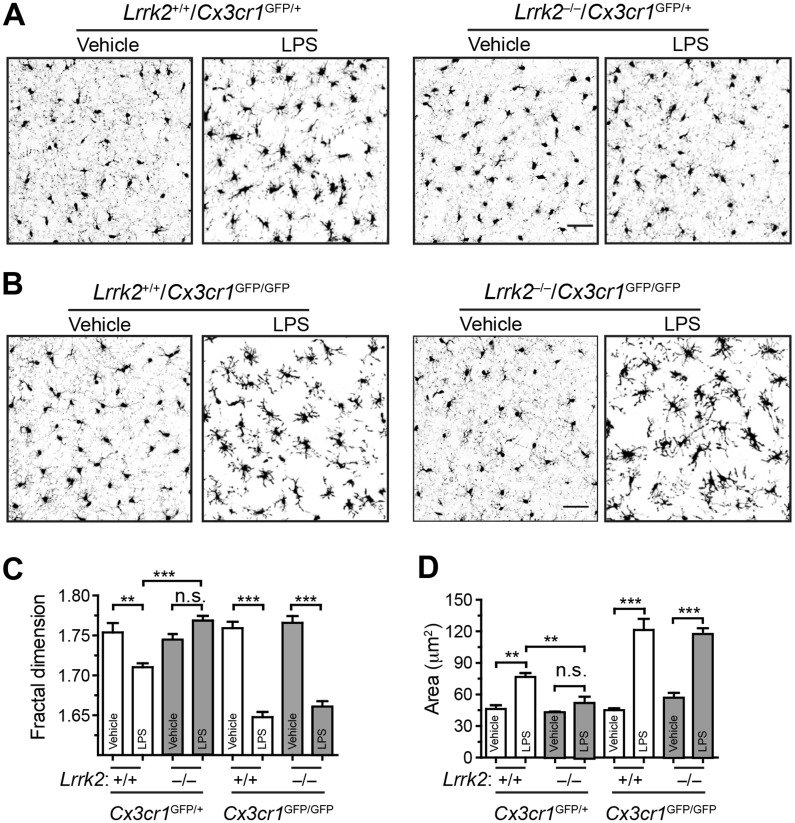
Figure 5.
Inhibition of CX3CR1 restores the responsiveness of Lrrk2–null microglia to LPS stimulation. (A, B) Representative images show GFP signals at the dorsal striatum of Lrrk2+/+/Cx3cr1GFP/+ and Lrrk2–/–/Cx3cr1GFP/+ (A), as well as Lrrk2+/+/Cx3cr1GFP/GFP and Lrrk2–/–/Cx3cr1GFP/GFP mice. Scale bars, 50 μm. (C, D) Bar graphs depict the measurements of fractal dimension (C) and area (D) of Lrrk2+/+/Cx3cr1GFP/+, Lrrk2–/–/Cx3cr1GFP/+, Lrrk2+/+/Cx3cr1GFP/GFP, Lrrk2–/–/Cx3cr1GFP/GFP microglia. Values represent means ± SEM. Significant differences between the groups are expressed as follows: **P<0.01; ***P<0.001. One-way ANOVA followed by Newman-Keuls multiple comparison tests. N = 4 per group.

