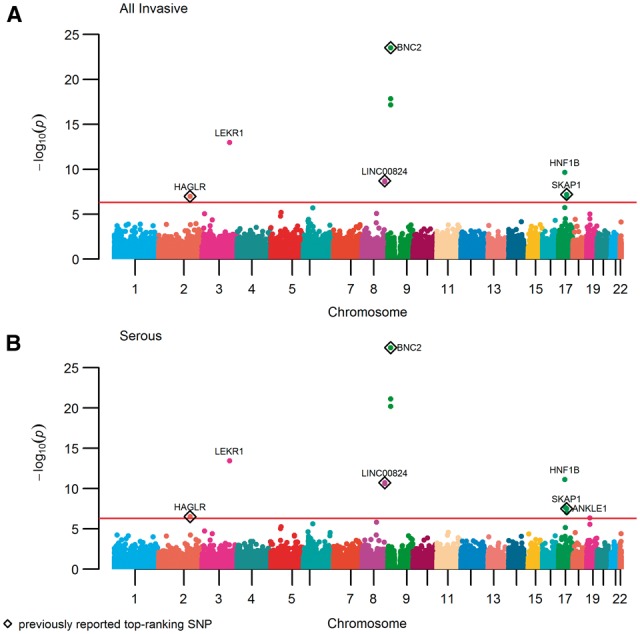
Figure 1.

Manhattan plot of association for 98,299 variants from a pooled analysis of Affymetrix and Illumina exome genotyping arrays. Plots show the strength of association versus chromosomal position for (A) all invasive EOC risk and (B) serous invasive EOC risk. The red line represents exome-wide significance (5.0 × 10 − 7). Exome-wide significant variants are annotated for the gene in which they are located. Known variants previously reported to have the strongest association signal are indicated by a black diamond.
