Figure 3.
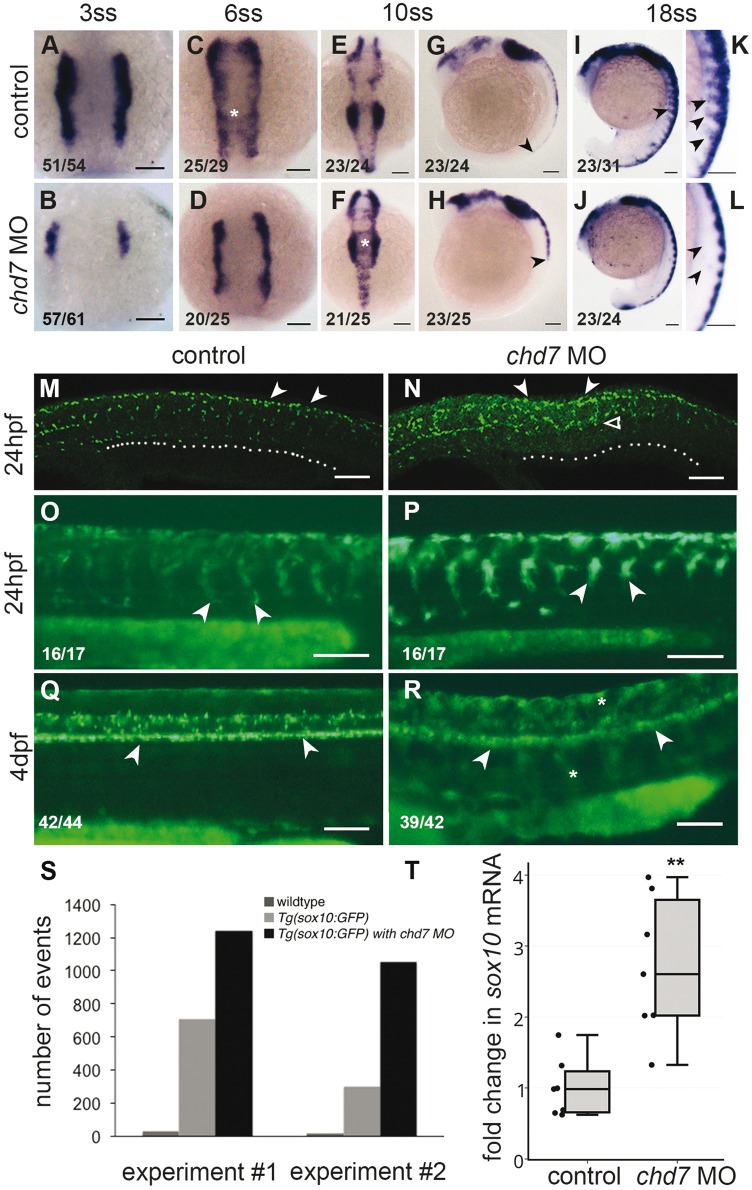
Chd7 knockdown causes deregulation of Sox10 expression in the neural crest. (A–L) RNA in situ hybridization of sox10 at different stages; control (A, C, E, G, I, K) and chd7 morphant (B, D, F, H, J, L). (A, B) At 3 somite stage (ss), Sox10, expressed in neural plate border cells is less in chd7 morphants. (C,D) At 6ss, the NC cells begin migration medially (asterisk) in control but not in chd7 morphants. (E–H) At 10ss, the medial migration concluded, cells condense in the vagal and cranial regions, while the chd7 morphants continue medial migration (asterisk) Dorsal views, with anterior to the top (A–F). (G, H) Lateral views of 10ss embryos shows that the NC stretches caudally to more than half the length of the control embryo, while in the chd7 morphants the crest was seen only in the anterior trunk region (black arrowheads). (I–L) At 18ss, Sox10 marks the ventrally migrating streaks of NC cells, which were absent or severely reduced in the chd7 morphants. (K, L) are magnified images of (I, J). Lateral views, with anterior to top (G–L). (M,N). At 24hpf, Sox10 antibody stained cells which have migrated to ventral region of embryo in control (white dots) while in chd7 morphant Sox10 positive cells have travelled only halfway (white open arrowhead) and are accumulated at the dorsal crest (white arrowheads). (O–P) At 24hpf, Tg(sox10:eGFP) marks NC cells that have migrated to the ventral-most region while chd7 morphant showed retention of GFP expression and abnormal migration of NC cells that have stuck midway (white arrowheads). (Q–R) At 4dpf, Tg(sox10:eGFP) shows sox10 expression in spinal cord (white arrowheads), however in chd7 morphant embryo spinal cord expression was not so evident but ectopic GFP positive cells appeared in the trunk region (white asterisks). Lateral views with anterior to left (M–R). (S) Flow cytometry analysis of sox10:eGFP positive cells showed a 1.7 fold to 3.5 fold expansion of GFP positive cell population in the chd7 morphants (T) Quantitative real time PCR analysis of sox10 mRNA showed upregulation in 24hpf chd7 morphant embryos (2.7 fold, P < 0.01). All scale bars are 100µm. The numbers in the bottom left corner indicate the actual number of embryos of the total represented by the image.

