Figure 7.
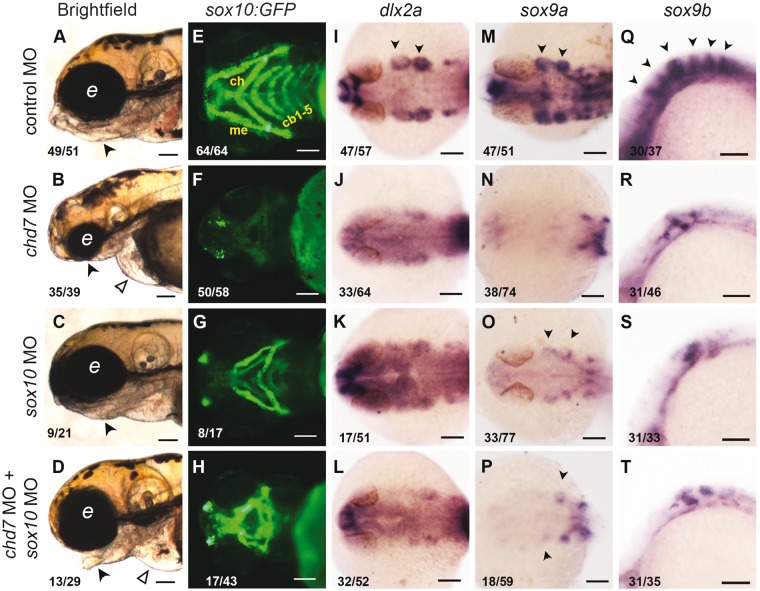
chd7 knockdown leads to defects in craniofacial cartilage specification and differentiation in a Sox10-dependent manner. (A–D) 4dpf control larvae exhibited a well-formed lower jaw (black arrowhead, A) while chd7 morphants had a missing lower jaw (black arrowhead, B, smaller head and pericardial edema (open arrowhead). Embryos injected with sox10 MO had partial loss of lower jaw (black arrowhead, C). Larvae coinjected with chd7 MO and sox10 MO showed partial rescue of the jaw structures (black arrowhead, D). (E–H) Tg(Sox10:eGFP) marks chondrocyte stacks in the jaw of 4dpf control larvae highlighting the Meckel’s (me), Ceratohyal (ch) and Ceratobranchial (cb1-5) cartilages. All major cartilage elements were absent in the chd7 morphant larvae (F) while ceratobranchial arches were absent in Sox10 morphants (G). Larvae coinjected with chd7 MO and sox10 MO had recovered significant cartilage structures (H). (I–T) RNA in situ hybridization of control (I, M, Q), chd7 MO (J, N, R), sox10 MO (K, O, S) and chd7 and sox10 MO coinjected 24 hpf embryos (l, p, t). Dlx2a marks the migratory NC cells in the pharyngeal arches (black arrowheads, I), which was downregulated in chd7 morphants and sox10 morphants (K). Embryos coinjected with chd7 and sox10 MO did not show any recovery of dlx2a expression (L). (M–P) sox9a which marks the craniofacial cartilage precursors in the pharyngeal arches (black arrowheads, m) was completely lost in the chd7 morphants (N). sox10 morphants had much reduced expression of sox9a (O). Embryos coinjected with chd7 and sox10 MO did not look very different from chd7 morphants (P). (Q–T) sox9b marks the perichondrium bands in control embryos (black arrowheads, Q) and this expression was reduced and the bands disorganized in the chd7 morphants (R) and sox10 morphants (S). Embryos coinjected with chd7 and sox10 MO were similar to the chd7 morphants with no rescue apparent (T). All images have anterior to the left, lateral view (A–D, Q–T) dorsal view (I–P), ventral view (E–H). All scale bars are 100µm. The numbers in the bottom left corner indicate the actual number of embryos of the total represented by the image.

