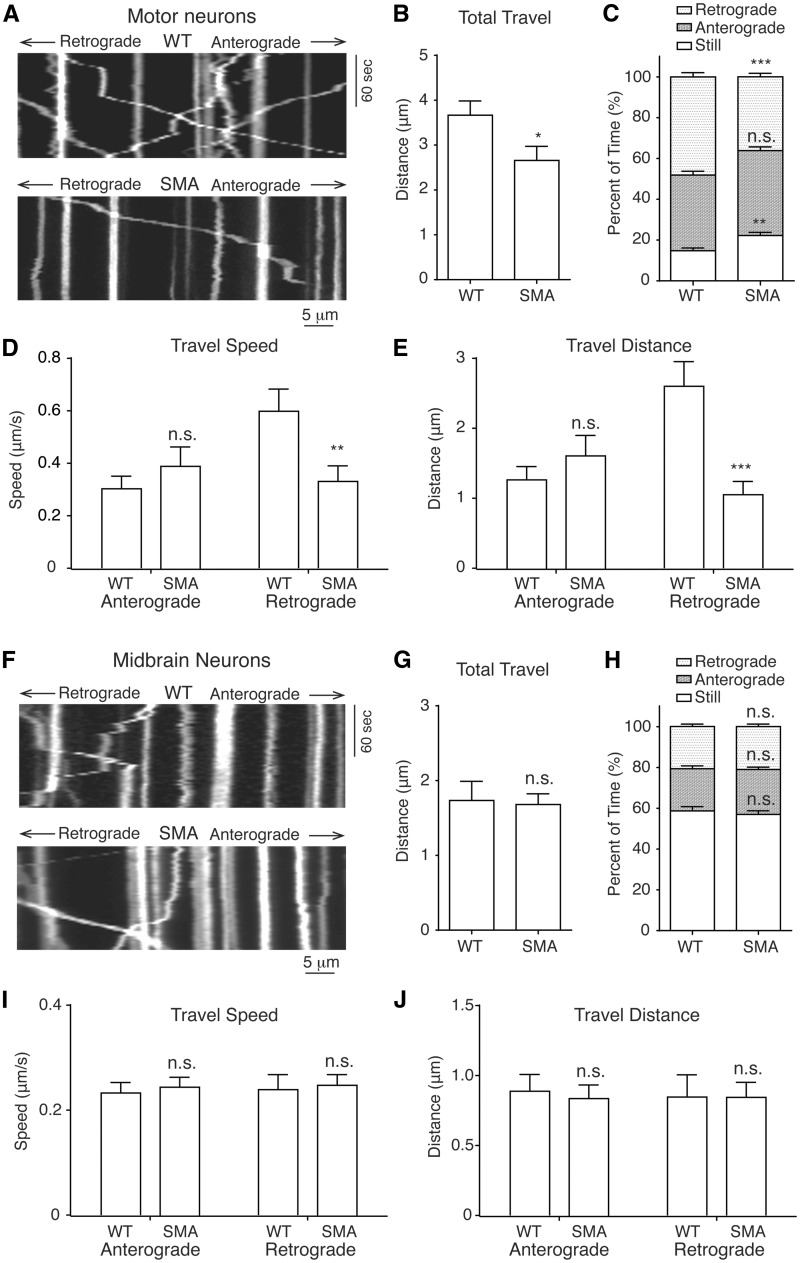
Figure 3.
Impaired mitochondrial transport in spinal motor neurons from Δ7 SMA mice. (A) Representative kymographs of mitochondrial transport in wild type and SMA mouse motor neuron axons. (B) The average total travel distance of all tracked mitochondria is significantly reduced in SMA motor neurons compared to wild type neurons (P = 0.03; WT: 174 mitochondria on 40 axons; SMA: 260 mitochondria on 58 axons). (C) The percent of time spent by all analysed mitochondria on retrograde movement was significantly reduced (P = 0.00002) in SMA motor neurons, while the percent of time spent in still was increased (P = 0.001), with no significant change of time in anterograde movement (P = 0.08). (D) The retrograde movement speed of mitochondria during their mobile phases was significantly reduced in SMA motor neurons (P = 0.008), but not the anterograde movement speed (P = 0.37). (E) The average total retrograde travel distance of all analysed mitochondria was significantly reduced in motor neurons affected by SMA (P = 0.00007), but not the anterograde travel distance (P = 0.37). (F) Representative kymographs of mitochondrial transport in wild type and SMA mouse midbrain neuron axons. (G) Analysis of mitochondrial transport showed that the average total travel distance of all tracked mitochondria in SMA mouse midbrain neurons was not significantly different from that in wild type mice (P = 0.84; WT: 316 mitochondria on 23 axons; SMA: 378 mitochondria on 33 axons). (H-J) No significant difference between SMA mouse and wild type mouse midbrain neurons in characteristics of mitochondrial movement including percent of time in immobility (P = 0.53), retrograde (P = 0.84) or anterograde (P = 0.47) movement, speed of retrograde (P = 0.80) or anterograde movement (P = 0.68), total anterograde (P = 0.69) or retrograde (P = 0.90) travel distance. n.s.: not significant; *P < 0.05; **P < 0.01; ***P < 0.001, Student’s t test.

