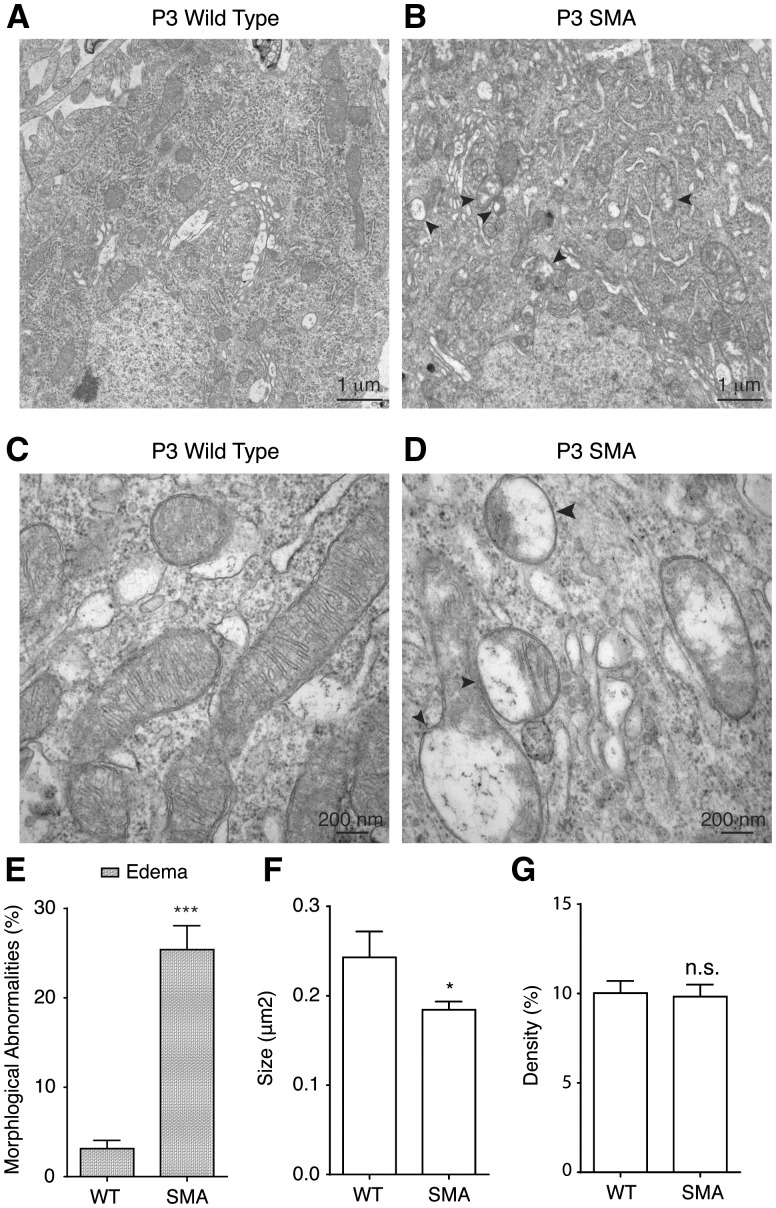
Figure 6.
Mitochondria show ultrastructural abnormalities in Δ7 SMA mice before the onset of disease symptom. (A-D) Representative low-magnification (A, B) and high-magnification (C, D) electron micrographs of mitochondria from lumbar 1 (L1) level spinal cord motor neurons in wild type and SMA mice at presymptomatic stage postnatal day 3 (P3). Mitochondria in P3 SMA mice showed edema (arrow heads in B, D), but not concentric lamellar inclusions, with decreased cristae density. (E) 25% mitochondria in L1 level motor neurons in presymptomatic P3 SMA mice displayed edema compared to 3% mitochondria in P3 wild type mice (P = 0.00001; WT: 326 mitochondria from three wild type mice, SMA: 883 mitochondria from three SMA mice). (F) Average size of mitochondria in L1 level motor neurons in P3 SMA mice was significantly smaller than that in P3 wild type mice (P = 0.02, WT: 326 mitochondria from three wild type mice, SMA: 883 mitochondria from three SMA mice). (G) Mitochondria density in L1 level motor neurons in presymptomatic P3 SMA mice was similar to that in P3 wild type mice (P = 0.85, WT: 326 mitochondria from three wild type mice, SMA: 883 mitochondria from three SMA mice). Results are mean ± SEM, from at least three independent experiments. n.s: not significant; *P < 0.05; ***P < 0.001, Student’s t test.

