Figure 7.
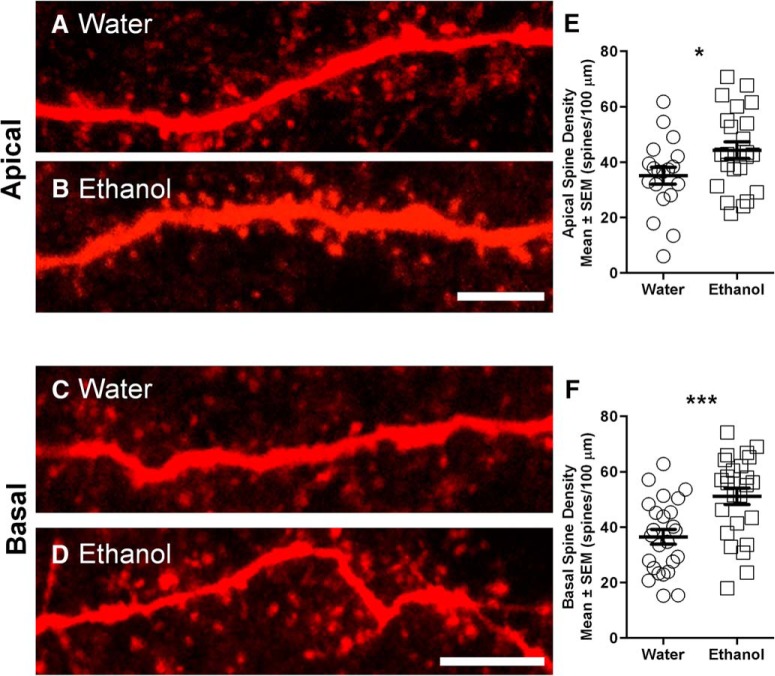
Increased dendritic spine density in both apical and basal dendrites of mPFC LVPNs from ethanol-consuming rats compared with water-consuming controls. A, B, High-magnification images of apical dendritic segments of mPFC LVPNs from water-consuming controls (A) and ethanol-consuming rats (B). C, D, High-magnification images of basal dendritic segments of mPFC LVPNs from water-consuming controls (A) and ethanol-consuming rats (B). E, F, Scatterplots with mean ± SEM of total spine density per 100 μm of apical dendrite (water, n = 19; ethanol, n = 23) and basal dendrite (water, n = 25; ethanol, n = 25), respectively. Unpaired two tailed Student’s t tests, *p < 0.05, ***p < 0.001. Scale bars, 5 μm.

