
Figure 2. Analysis of ZIKV infection in NPC cultures.
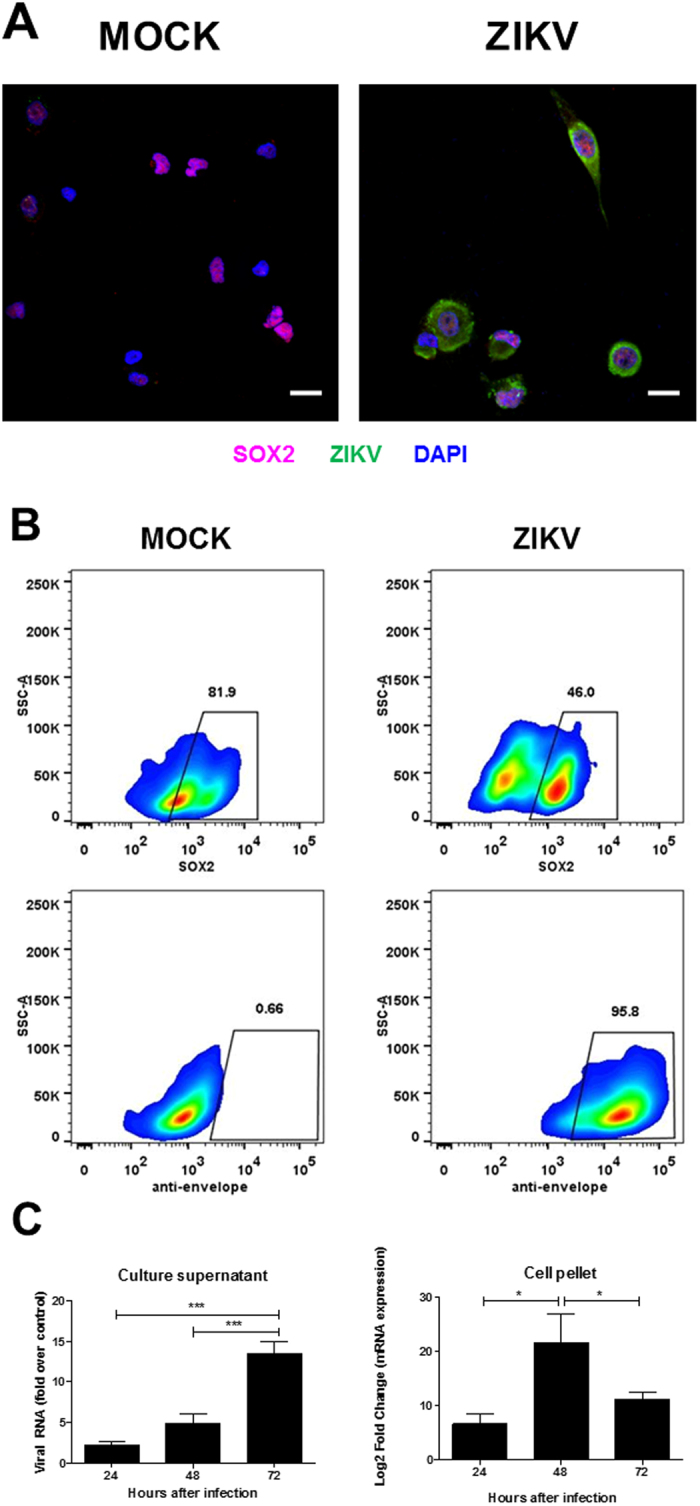
(A) Immunostaining for ZIKV and Sox2 in NPC cultures. Nuclei are stained with DAPI. Scale bars = 20 μm. (B) Flow cytometry analysis for quantification of Sox2+ and ZIKV+ cells 48 h after infection. (C) Quantification of viral RNA in culture supernatants and cell pellets by RT-qPCR 24, 48 and 72 h after ZIKV infection. Data normalized using the values obtained at 2 h time point (supernatant) or endogenous control gene (GAPDH; pellet), and are represented as mean ± SEM. *p < 0.05; ***p < 0.001.