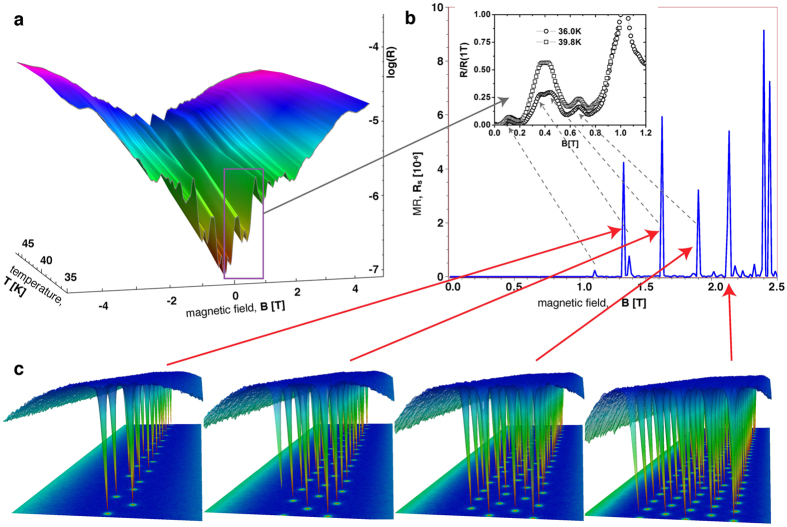
Figure 2. Magnetoresistance and vortex configurations.
(a) Experimental MR of the 230 nm wide sample, in log-linear scale as a function of temperature. Important to note is that the position of the peaks does not change much with temperature. (b) Simulated MR of a 2D system with dimensions similar to those of the experimental system. The simulated temperature is lower than that in the experiment leading to sharper peaks, which are realized at higher fields. The periodicity and the relative peak heights are however reproduced correctly. The inset shows comparable experimental curves at 36 K and 39.8 K at low fields. (c) Vortex configurations at the peaks of the simulated MR curve. The peaks of the MR mark the appearance of a new vortex row entering the strip. The plots show isosurfaces of the superconducting order parameter amplitude and a color plot of the order parameter density as projection on the bottom.

