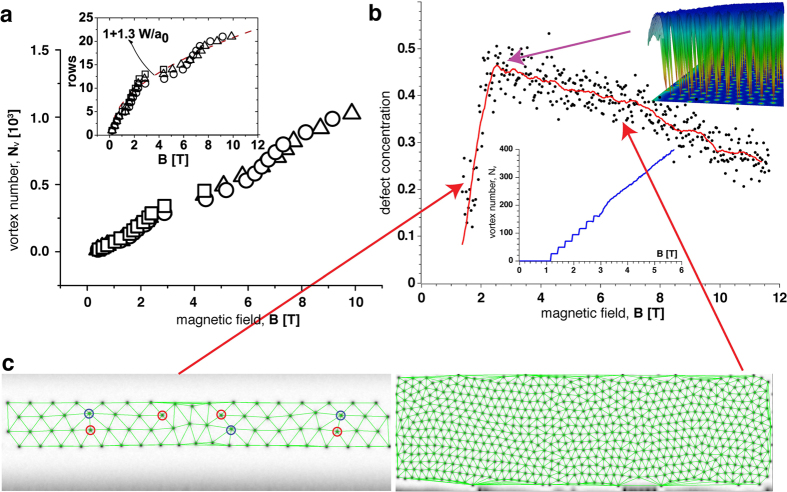
Figure 4. Vortex lattice melting transition.
(a) The number of nucleated fluxons as a function of the applied magnetic field. The points shown by triangles, circles, and squares are recorded at 36.0 K, 39.8 K, and 46.5 K, respectively. The (red) dashed line is a linear fit of the data at 39.8 K. Inset: the number of the entered vortex rows as a function of B. The dashed curve is the function  where
where  which represents the theoretical trend expected for an ordered vortex lattice. (b) Analysis of the simulated vortex lattices as a function of field. The plot shows the topological defect concentration (vortices with number of closest neighbours different from 6) obtained by Delaunay triangulation. The edge rows are not taken into account, such that the curve starts when the third row is formed. The scattering plot shows a typical run, and the red curve is an average of 12 runs with the different random initial configurations. When the vortex lattice starts moving at B ~ 3T the defect concentration shows a maximum (a typical vortex configuration at the maximum is shown at the top right corner). The inset shows the vortex number as a function of the magnetic field. At low fields, below the dynamic transition the vortex number shows a clear step-like behaviour when new vortex rows appear. At high fields the vortex number increases continuously. Two typical vortex lattice triangulations are shown in panel (c) (topological defects having 5 and 7 nearest neighbors are highlighted by red and blue circles, respectively, on the left.)

