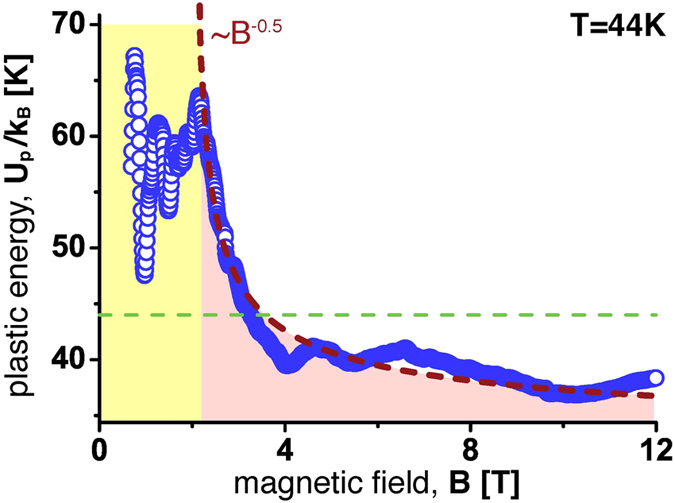
Figure 5. Plastic Energy Up as a function of the magnetic field.

The gray dashed line is a  fit demonstrating that the data is consistent with the expected behaviour due to plastic deformation resulting from vortex shear13,28,29. The straight green dashed line corresponds to the temperature T = 44 K of the experiment.
