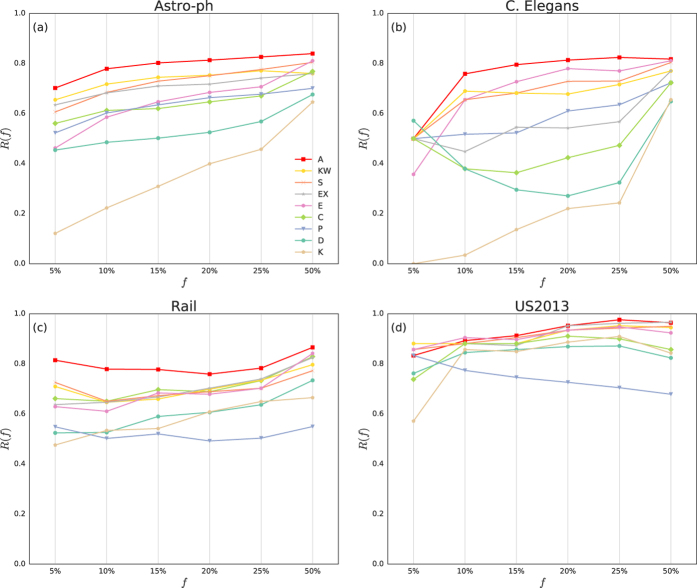
Figure 3. Aggregated solution can better identify super-spreaders as compared to the individual centrality measures.
Different values of f are given in x-axis, while the corresponding recognition rate changes in y-axis. In this figure, we show the following data-sets: Astro-ph (a), C. Elegans (b), Rail (c), and US2013 (d).

