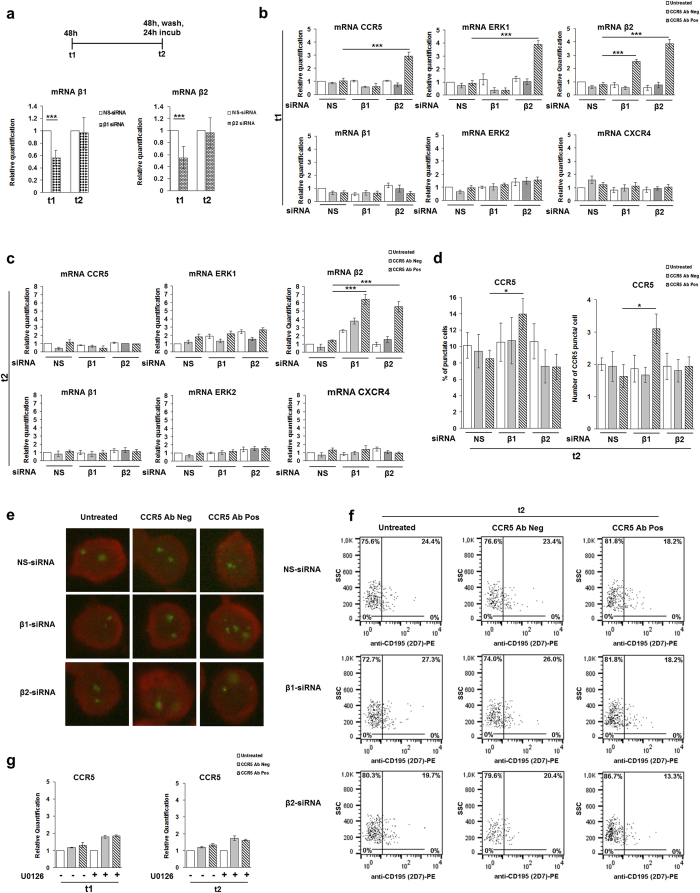
Figure 3. siRNAs specific for β-arrestin1/2, but not U0126 treatment, influence the CCR5 gene expressions pathway.
(a) Schematic representation of kinetics experiment and real time RT-PCR analysis of β-arrestin1 and 2 genes expression in R5-SupT1-L23 cells nucleofected with siRNAs directed to β-arrestin1 (β1), β-arrestin2 (β2), compared with NS-siRNA. (b,c) Real time RT-PCR analysis of CCR5, ERK1, ERK2, β-arrestin2 (β2), β-arrestin1 (β1) and CXCR4 in the cells harvested after treatment either with anti CCR5 Ab Pos or CCR5 Ab Neg at t1 (corresponding to 48 h of factors incubation) (b), at t2 (corresponding to 48 h of factors incubation, washing and a further 24 h of cells incubation in medium without stimuli), compared with untreated cells of the control group (c). (d) The percentage of cells with the punctate form of CCR5 (left) and the number of CCR5 puncta per cell (right) in untreated and treated cells with antibodies (CCR5 Ab Pos and CCR5 Ab Neg) in siRNAs nucleofected R5-SupT1-L23 cells, stained with anti-CKR5(D6), are reported. (e) A representative immunofluorescence image of CCR5-positive cells. Evans Blue dye was used as a counter stain. (f) CCR5 cell surface expression (measured by flow cytometry with specific Mab to CCR5 (CD195)) in R5-SupT1-L23 cells nucleofected with siRNAs against β-arrestin1 (β1) and β-arrestin2 (β2) stimulated or not with CCR5 Ab Pos and CCR5 Ab Neg, at t2. Data are representative of three independent experiments. (g) Real time RT-PCR analysis of CCR5 in cells pre-treated, or not, with the U0126 (MAPKs inhibitor) for 1 h and stimulated with CCR5 Ab Pos and the appropriate control, compared to the untreated cells at t1 (left) and t2 (right). In Panels a–d, g, bar graphs represented mean ± SD of three independent experiments. Student’s t-test was performed and p values are shown. *p ≤ 0.05, **p ≤ 0.01, ***p ≤ 0.001.

