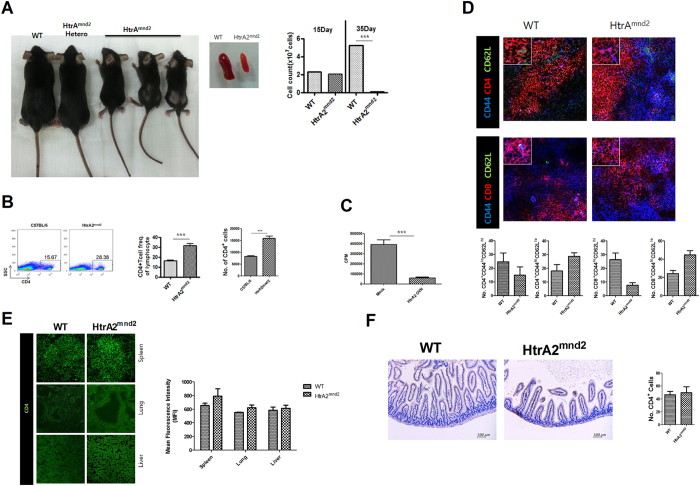
Figure 1. HtrA2 regulates T cell activation.
(A) WT and HtrA2mnd2 phenotype mice. (B) The WT and HtrA2mnd2 mutant mice CD4+ T cell populations were analyzed by flow cytometry (n = 6). (C) A T cell proliferation response assay (MLR) was conducted to measure T cell activity of LBRM transfected with HtrA2 or mock vector (n = 3). (D) CD4+CD44+CD62L+ and CD4+CD44+CD62L+ T cell populations in WT and HtrA2mnd2 mutant mice were analyzed by confocal scanning microscopy (n = 3). (E) CD4+ T cell populations in spleen, lung, and liver from WT and HtrA2mnd2 mutant mice were examined by confocal scanning microscopy (n = 3). (F) The CD4+ T cell populations in colon from WT and HtrA2mnd2 mutant mice were measured by immunocytochemistry (n = 3). Data are mean ± standard deviation of three independent experiments (***P < 0.01).

