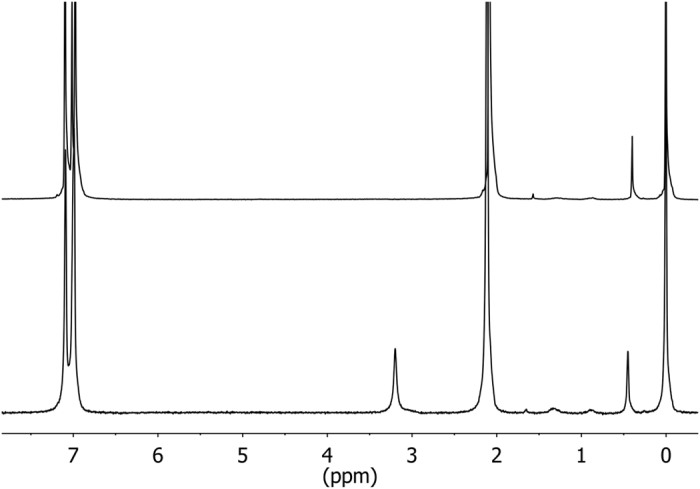
Figure 3. Proton NMR spectra of samples described in Fig. 2 at 800 MHz and at 300 K (top) or 363 K (bottom).

The signals at 2.1 and 7 ppm are attributed to residual protons in incompletely deuterated toluene-d8. The signal at 3.2 stems from water in gas phase. Small peaks between 0.3 and 2 ppm are due to impurities in toluene-d8. We diluted TMS in toluene-d8 to use its resonance at 0 ppm as chemical shift reference.
