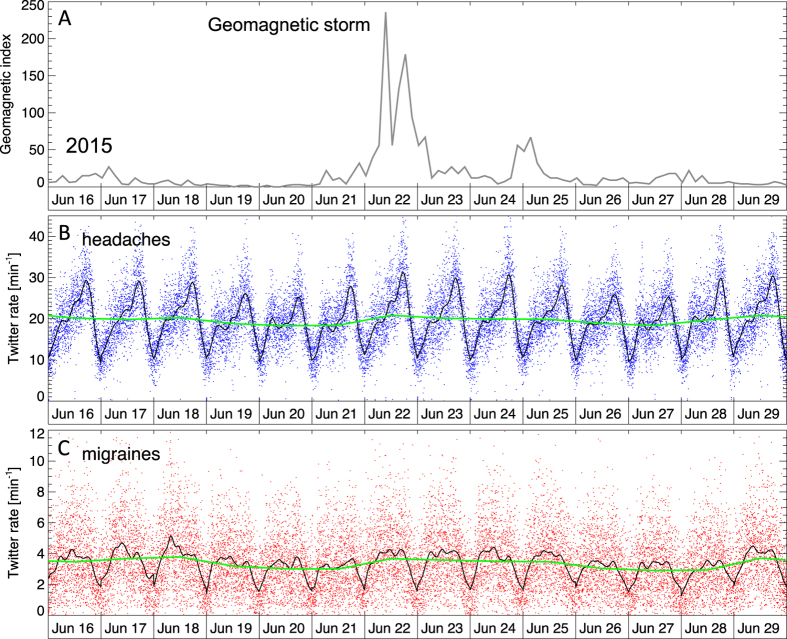
Figure 1.
Rate of Twitter messages pertaining to headaches (B) and migraines (C) during the two-week period surrounding the most intense geomagnetic storm of the current solar cycle, peaking on June 22, 2015. Panel A shows the values of the global geomagnetic index ap. Panels B and C show Twitter rates (messages per minute) for headaches (blue dots) and migraines (red dots), respectively. Black curves are smoothed trends and green lines the daily averages. No enhancement in symptoms reporting rate is seen in relation to the storm.

