Figure 8.

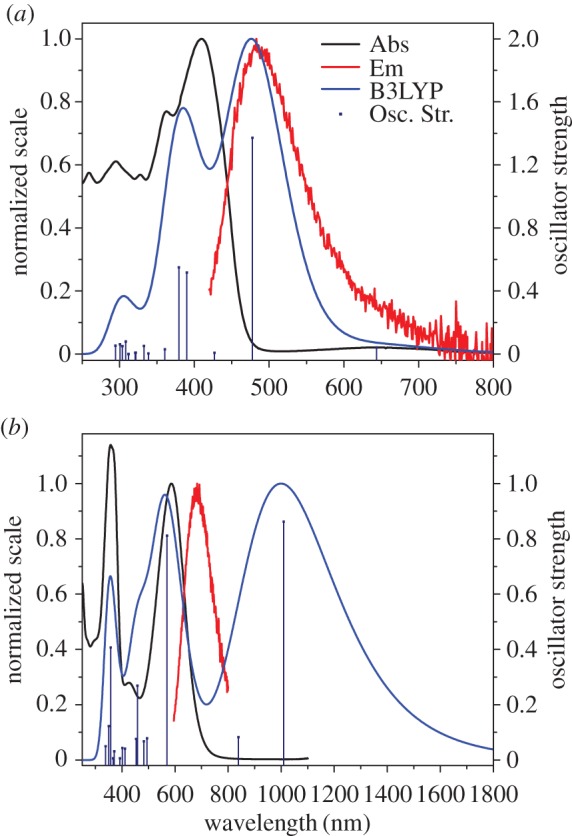
Absorption (black) and emission (red) spectra recorded for 3b in DCM (a) and 3bH+ in 10% TFA/DCM (b) overlaid with their respective calculated absorption spectra (blue line) and oscillator strengths (blue bars).

Absorption (black) and emission (red) spectra recorded for 3b in DCM (a) and 3bH+ in 10% TFA/DCM (b) overlaid with their respective calculated absorption spectra (blue line) and oscillator strengths (blue bars).