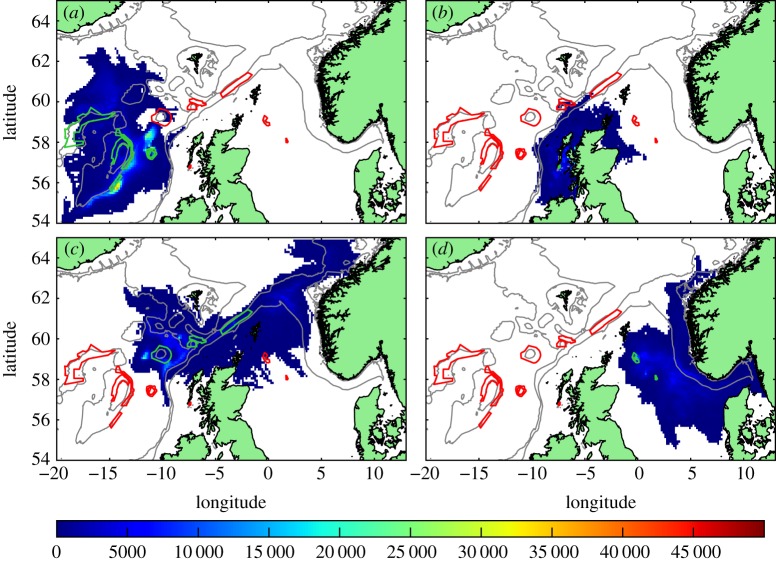
Figure 3.
Standard run. Distribution of competent larvae, ready to settle, plotted by source MPAs (shown in green outline, other MPAs red outline). Larval source: (a) western MPAs, (b) East Mingulay, (c) northern MPAs and (d) North Sea sites. Colour scale is the number of larval days recorded in the model grid square. Each model day the positions of the larvae are examined and each competent larva in a grid-box counts 1. A figure of 20 000 could, for example, be 20 000 larvae in the grid square for one day each, or 400 larvae for 50 days each, etc.

