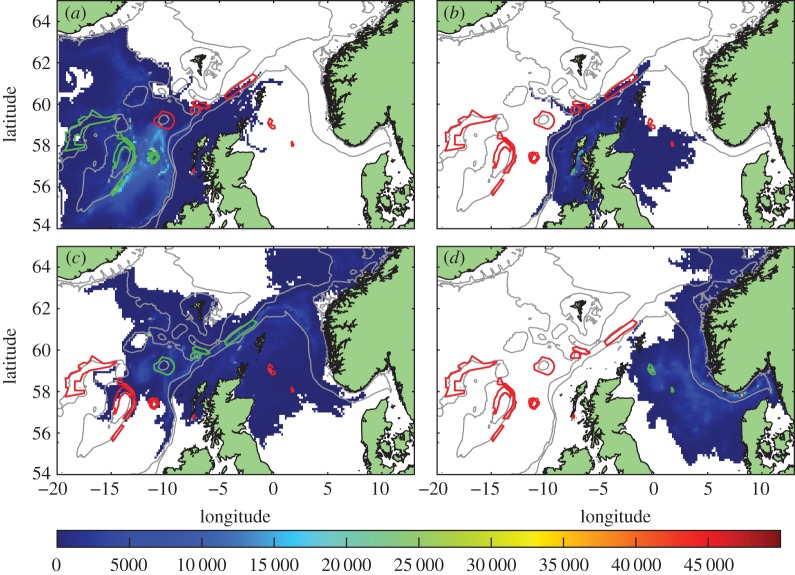
Figure 5.
Distribution of competent larvae, ready to settle, in the long-lived run. Plotted by source MPAs (shown in green outline, other MPAs red outline). Larval source: (a) western MPAs, (b) East Mingulay, (c) northern MPAs and (d) North Sea MPAs. Colour scale is the number of larval days recorded in the model grid square.

