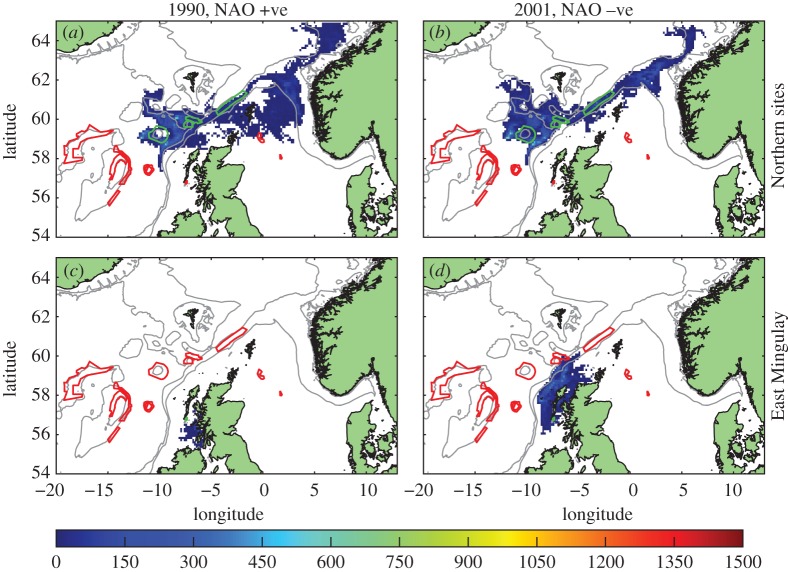
Figure 8.
Heat map of competent larval distribution (as for figure 3) for releases in single years, demonstrating interannual variability. (a) Source northern MPAs, 1990. (b) Source northern MPAs, 2001. (c) Source East Mingulay, 1990. (d) Source East Mingulay, 2001. Source MPAs outlined in green, other MPAs in red. Scale represents larval days spent in the model grid square.

