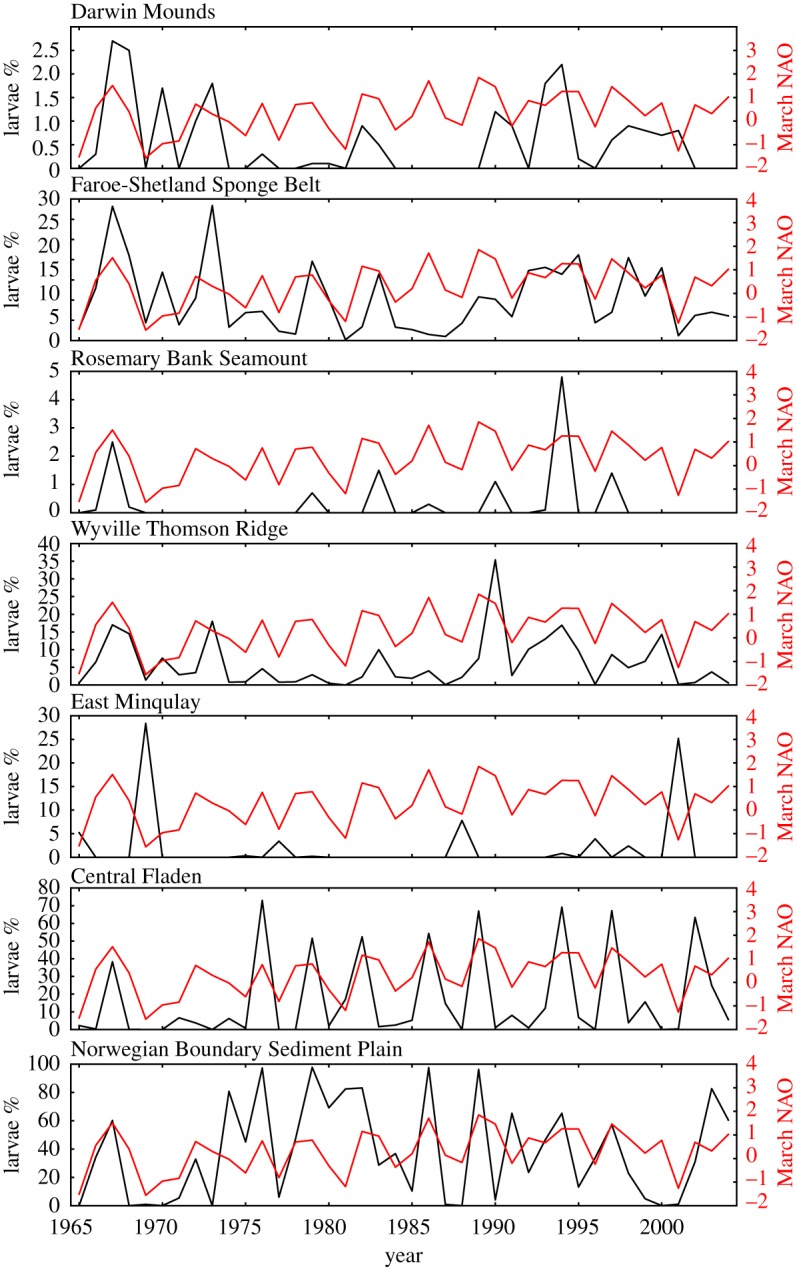
Figure 9.

Black line, left scale: percentage of larvae released from each site crossing the shelf break (sections S1, S2) each year. Red line, right scale: NAO monthly average index for March. Source sites East Rockall Bank, Hatton Bank, Northwest Rockall Bank, Southeast Rockall Bank, Anton Dohrn Seamount are not shown as no larvae from these sites cross the shelf break.
