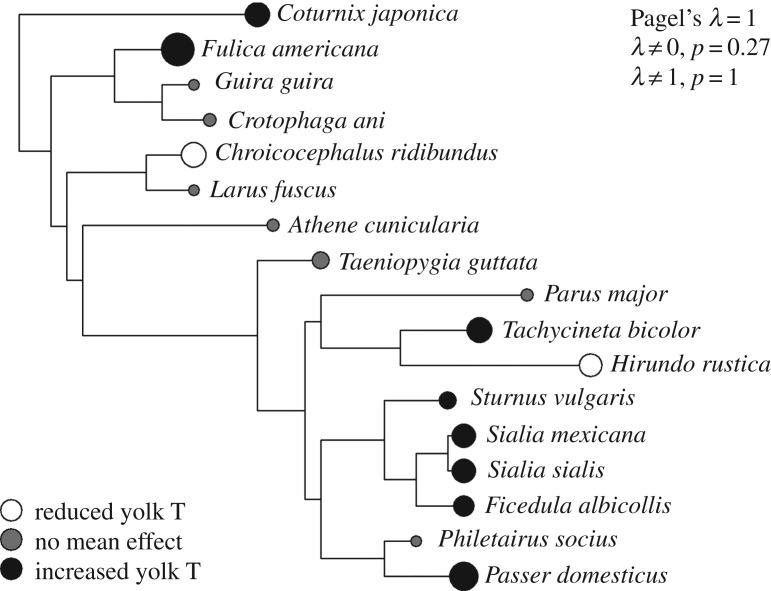
Figure 1.
Phylogenetic visualization of mean yolk testosterone response per species included in the main analyses. The displayed tree was pruned from the complete tree of life [82], with each point representing the weighted average effect size per species. Circle size represents the magnitude of the relationship between yolk testosterone response and competitive environment, and the directionality of this relationship is given in the key and is based on the significance of findings from their respective studies. Results from likelihood ratio tests for phylogenetic signal (Pagel's λ) are provided in the legend.

