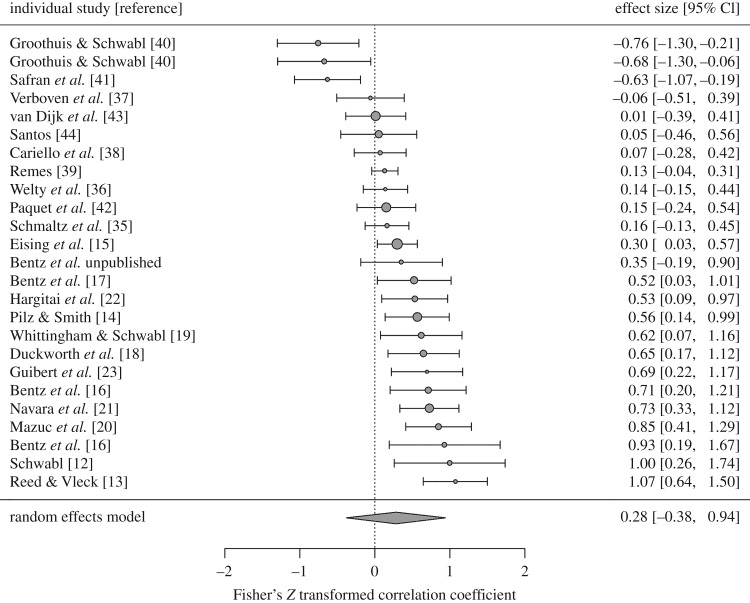
Figure 2.
Distribution of effect sizes for relationships between competitive environment and yolk testosterone response (Fisher's Z ± 95% CIs). Circle size is scaled inversely proportional to the sampling variance, and points to the left of the dashed line indicate cases where competitive environment was associated with decreased yolk testosterone. The diamond displays the estimated true effect from the multilevel REM fit with restricted maximum likelihood.

